Asia Pacific Edible Oils and Fats Market
No. of Pages: 103 | Report Code: BMIRE00029885 | Category: Food and Beverages
No. of Pages: 103 | Report Code: BMIRE00029885 | Category: Food and Beverages
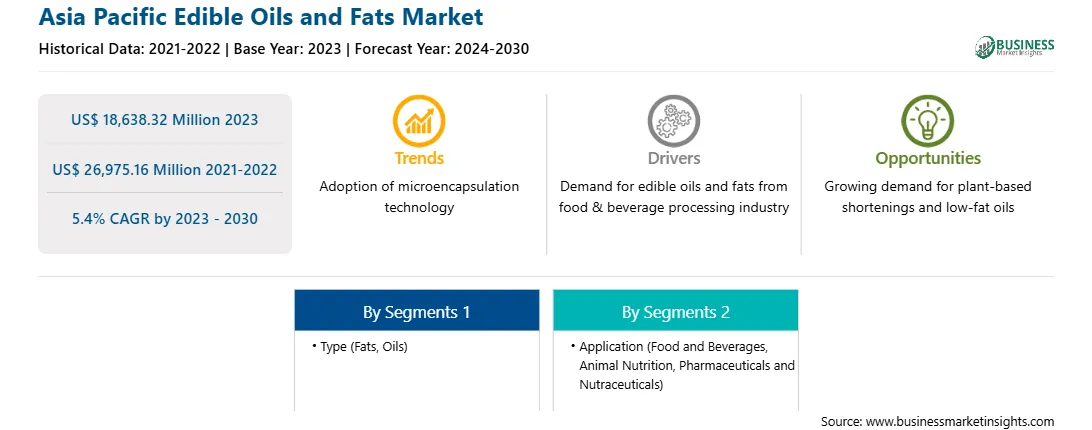
According to the Organization for Economic Co-operation and Development (OECD), in 2022, the consumption of vegetable oil reached 249 million metric tons, with the food sector accounting for the major share. Furthermore, the COVID-19 pandemic caused short-term disruptions in the oilseed and oilseed product markets, which led to sharp price hikes in the second half of 2020. This price increase is the result of restricted supply growth, particularly for palm oil, and strong demand, particularly for imported soybeans by China. Over the period of 2021-30, soybean production is expected to rise by 1.1% per year. By 2030, soybean production is predicted to reach 411 Mt, more than twice the total production of all oilseeds (groundnuts, sunflower seeds, and rapeseed), which is projected to be 179 Mt. 90% of soybeans and 87% of other oilseeds are processed into protein meal, which is nearly exclusively used for feed, and vegetable oil, which is used for food, oleochemicals, and biodiesel. Moreover, the confectionery industry significantly utilizes butter as a primary ingredient, followed by margarine. The high-quality edible oils and fats are used in bakery and confectionery, dairy and frozen desserts, snacks, Ready-to-Eat (RTE) and Ready-to-Cook (RTC) meals, and other food and beverage items. Refined oils and fats are a rich source of lipids. Thus, their use is increasing due to rising application and growing global population. The food & beverages industry in various regions such as North America and Asia Pacific is continuously growing owing to an upsurging inclination toward sustainability, preference for convenience and ready-to-eat products, and rising adoption of organic and plant-based products. The industry is witnessing substantial motion with innovation in processes, products, and services to cater to rapidly changing consumer preferences. Thus, the growing food & beverages industry across the globe propels the demand for edible oils and fats.
The Asia Pacific edible oils and fats market is segmented into Australia, China, India, Japan, South Korea, and the Rest of Asia Pacific. The market growth is attributed to increasing demand for bakery products, especially breads, cakes, pastries, and muffins, coupled with the growing influence of Western culture on the millennial and Gen-z population in the region. The bakery sector in China witnessed tremendous growth, with retail sales of bakery products accounting for US$ 34 billion in 2020, according to the United States Department of Agriculture (USDA). Moreover, manufacturers of edible oils and fats actively operate across the region and offer edible oils and fats made with fine-quality oil or its fractions. Distinct melting profiles of butter and margarines, packaging types, and the expansion of antifoaming or antioxidant agents of edible oils and fats are available across the region and widely applicable in many end-use industries such as confectionery, bakery, dairy, and infant nutrition.
Companies such as Cargill Incorporated, Novozymes, ADM, and Kerry Group Plc operate actively in the region. These domestic and international players often use strategic initiatives to expand their businesses. In November 2021, Cargill, Incorporated invested US$ 35 million in establishing its production facility of specialty fats in Malaysia to cater to the growing demand for specialty fats. This Cargill’s dry palm fractionation facility currently serves chocolates, confectionery, coating, fillings and compounds, spreads, bakery, and other end-use industries with its different products in the edible oils and fats segment. Additionally, in July 2023, Novozymes announced its expansion of Kuala Lumpur’s 2,000 square feet palm oil facility by 800 Sq. Ft. in Asia Pacific.
Edible oils and fats also have significant applications in non-food sectors such as animal nutrition, pharmaceuticals, and nutraceuticals. In animal nutrition, these products are used in animal feed formulation, contributing to the market's growth. Also, technological advancements, such as efficient extraction methods and refining processes, enhance the quality and yield of edible oils and fats. This, in turn, boosts production capacities and meets the rising demand from pharmaceuticals and nutraceuticals industries, thereby driving market expansion.
The Asia Pacific edible oils and fats market is segmented based on type, application, and country.
Based on type, the Asia Pacific edible oils and fats market is bifurcated into oils and fats. The oils segment held a larger share in 2023. The fats segment is further subsegmented into butter, margarine, palm oil based shortening, vegetable oil based shortening, and others. The oils segment is further subsegmented into soybean oil, sunflower oil, palm oil, canola oil/rapeseed oil, and others.
By application, the Asia Pacific edible oils and fats market is segmented into food and beverages, animal nutrition, pharmaceuticals and nutraceuticals. The food and beverages segment held the largest share in 2023. The food and beverages segment is further subsegmented into bakery and confectionery, Dairy and frozen desserts, RTE and RTC meals, snacks, and others.
Based on country, the Asia Pacific edible oils and fats market is segmented into China, Japan, India, Australia, South Korea, and the Rest of Asia Pacific. The Rest of Asia Pacific dominated the Asia Pacific edible oils and fats market in 2023.
AAK AB, Archer-Daniels-Midland Co, Bunge Ltd, Cargill Inc, ConnOils LLC, Fuji Oil Co Ltd, J-Oil Mills Inc, Kao Corp, Louis Dreyfus Co BV, and Olam Group Ltd are some of the leading companies operating in the Asia Pacific edible oils and fats market.
Strategic insights for the Asia Pacific Edible Oils and Fats provides data-driven analysis of the industry landscape, including current trends, key players, and regional nuances. These insights offer actionable recommendations, enabling readers to differentiate themselves from competitors by identifying untapped segments or developing unique value propositions. Leveraging data analytics, these insights help industry players anticipate the market shifts, whether investors, manufacturers, or other stakeholders. A future-oriented perspective is essential, helping stakeholders anticipate market shifts and position themselves for long-term success in this dynamic region. Ultimately, effective strategic insights empower readers to make informed decisions that drive profitability and achieve their business objectives within the market.
| Report Attribute | Details |
|---|---|
| Market size in 2023 | US$ 18,638.32 Million |
| Market Size by 2030 | US$ 26,975.16 Million |
| Global CAGR (2023 - 2030) | 5.4% |
| Historical Data | 2021-2022 |
| Forecast period | 2024-2030 |
| Segments Covered |
By Type
|
| Regions and Countries Covered | Asia-Pacific
|
| Market leaders and key company profiles |
The geographic scope of the Asia Pacific Edible Oils and Fats refers to the specific areas in which a business operates and competes. Understanding local distinctions, such as diverse consumer preferences (e.g., demand for specific plug types or battery backup durations), varying economic conditions, and regulatory environments, is crucial for tailoring strategies to specific markets. Businesses can expand their reach by identifying underserved areas or adapting their offerings to meet local demands. A clear market focus allows for more effective resource allocation, targeted marketing campaigns, and better positioning against local competitors, ultimately driving growth in those targeted areas.
1. AAK AB
2. Archer-Daniels-Midland Co
3. Bunge Ltd
4. Cargill Inc
5. ConnOils LLC
6. Fuji Oil Co Ltd
7. J-Oil Mills Inc
8. Kao Corp
9. Louis Dreyfus Co BV
10. Olam Group Ltd
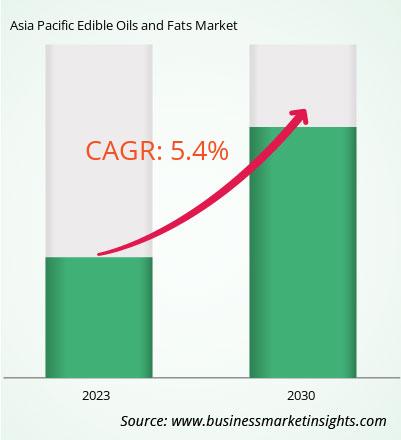
The Asia Pacific Edible Oils and Fats Market is valued at US$ 18,638.32 Million in 2023, it is projected to reach US$ 26,975.16 Million by 2030.
As per our report Asia Pacific Edible Oils and Fats Market, the market size is valued at US$ 18,638.32 Million in 2023, projecting it to reach US$ 26,975.16 Million by 2030. This translates to a CAGR of approximately 5.4% during the forecast period.
The Asia Pacific Edible Oils and Fats Market report typically cover these key segments-
The historic period, base year, and forecast period can vary slightly depending on the specific market research report. However, for the Asia Pacific Edible Oils and Fats Market report:
The Asia Pacific Edible Oils and Fats Market is populated by several key players, each contributing to its growth and innovation. Some of the major players include:
The Asia Pacific Edible Oils and Fats Market report is valuable for diverse stakeholders, including:
Essentially, anyone involved in or considering involvement in the Asia Pacific Edible Oils and Fats Market value chain can benefit from the information contained in a comprehensive market report.
Office No. 1011, First floor, Farena Corporate Park, Magarpatta-Mundhwa road, Pune - 411028, Maharashtra, India
US:+16467917070
sales@businessmarketinsights.com


 Get Free Sample For Asia Pacific Edible Oils and Fats Market
