Asia Pacific Diagramming Software Market
The presence of developing economies and high adoption of advanced as well as sophisticated technologies are among the factors contributing to the overall growth of Asia Pacific. Japan, China, India, Australia, and South Korea are major contributors to the growth of the diagramming software market in this region. Significant initiatives by governments, digitalization of economies, rapid technological developments, and rise in disposable income of the middle-income class are among the factors propelling the growth of the overall economy of the region, thereby driving it from a developing to a developed phase. A rise in the popularity of cloud-based diagramming software platforms is fueling the demand for diagramming software in APAC. Additionally, the rising adoption of these software by large enterprises and educational institutes and increasing advancements in technologies are boosting the diagramming software market growth in APAC countries. Asia Pacific is projected to register the highest CAGR in the global diagramming software market during the forecast period, owing to the increasing business and government spending on software (approximately US$ 130 billion). Growing access to the internet and the increasing presence of tech-savvy individuals can be associated with the widening scope for using advanced software such as diagramming software in this sector.
The COVID-19 pandemic has severely impacted APAC due to wide disease spread. Countries in this region are among the highly populated countries in the world, which leads to a greater risk of infection spread. Many global brands and technology companies are headquartered in APAC. According to the Organization for Economic Co-operation and Development (OECD), the pandemic has adversely affected major economies such as China, India, Australia, and Japan, which are experiencing inflation. The rapid COVID-19 outbreak led to strict lockdowns across the region since the starting of 2020.

Strategic insights for the Asia Pacific Diagramming Software provides data-driven analysis of the industry landscape, including current trends, key players, and regional nuances. These insights offer actionable recommendations, enabling readers to differentiate themselves from competitors by identifying untapped segments or developing unique value propositions. Leveraging data analytics, these insights help industry players anticipate the market shifts, whether investors, manufacturers, or other stakeholders. A future-oriented perspective is essential, helping stakeholders anticipate market shifts and position themselves for long-term success in this dynamic region. Ultimately, effective strategic insights empower readers to make informed decisions that drive profitability and achieve their business objectives within the market.
| Report Attribute | Details |
|---|---|
| Market size in 2021 | US$ 162.61 Million |
| Market Size by 2028 | US$ 356.26 Million |
| Global CAGR (2021 - 2028) | 11.9% |
| Historical Data | 2019-2020 |
| Forecast period | 2022-2028 |
| Segments Covered |
By Deployment Type
|
| Regions and Countries Covered | Asia-Pacific
|
| Market leaders and key company profiles |
The geographic scope of the Asia Pacific Diagramming Software refers to the specific areas in which a business operates and competes. Understanding local distinctions, such as diverse consumer preferences (e.g., demand for specific plug types or battery backup durations), varying economic conditions, and regulatory environments, is crucial for tailoring strategies to specific markets. Businesses can expand their reach by identifying underserved areas or adapting their offerings to meet local demands. A clear market focus allows for more effective resource allocation, targeted marketing campaigns, and better positioning against local competitors, ultimately driving growth in those targeted areas.
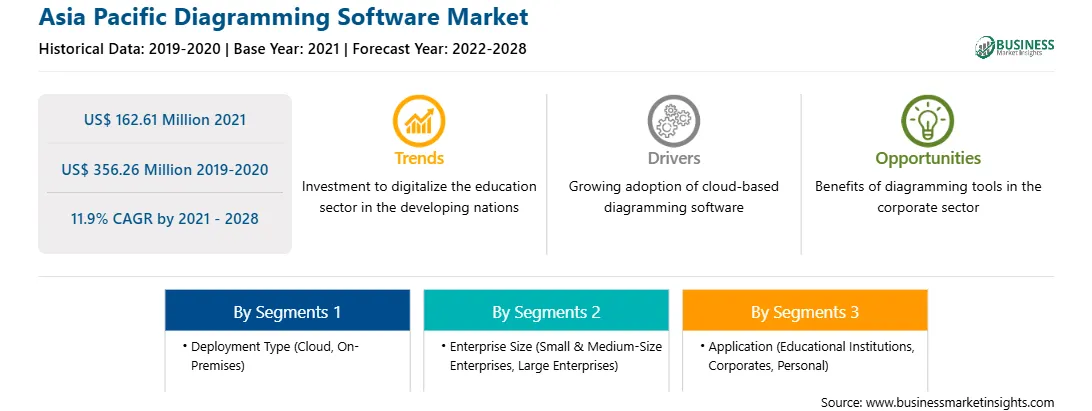
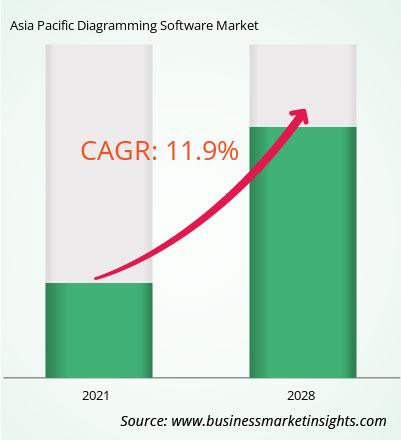
The diagramming software market in APAC is expected to grow from US$ 162.61 million in 2021 to US$ 356.26 million by 2028; it is estimated to grow at a CAGR of 11.9% from 2021 to 2028. Integration of advanced technologies with diagramming software; automation in documentation and diagramming is being highly adopted across industries to eliminate repetitive human work. Technologies like artificial intelligence (AI) are integrated with diagramming software to automate the creation of flowcharts, organization charts, mapping charts, and workflows. The integration of advanced technologies like AI with diagramming solutions is enabling the automation across both the creation and updating of charts based on pre-entered criteria. For instance, Edrawsoft offers an automatic vector-based org chart maker solution that enables enterprises to create organizational charts in various formats such as basic organization charts, photo organization charts, family trees, custom organization charts, and people organization charts. The solution is integrated with human resource systems, and it automatically makes the charts based on information and designation available on such systems. The solution also updates the information automatically when an employee leaves the organization. These advantages are expected to influence the adoption of technologically advanced diagramming software. Thus, the above-mentioned factors are expected to propel the growth of the APAC diagramming software market over the forecast period. This is bolstering the growth of the diagramming software market.
Based on deployment type, the diagramming software market can be bifurcated into cloud and on-premises. In 2020, the cloud segment held the largest share APAC diagramming software market. Based on enterprise size, the diagramming software market is categorized into small & medium-size enterprises and large enterprises. In 2020, the large enterprises segment held the largest share APAC diagramming software market. Based on application, the diagramming software can be categorized into educational institutions, corporates, and personals. The corporates segment contributed a substantial share in 2020.
A few major primary and secondary sources referred to for preparing this report on the diagramming software market in APAC are company websites, annual reports, financial reports, national government documents, and statistical database, among others. Major companies listed in the report are CREATELY (CINERGIX PTY LTD); Edrawsoft; Gliffy (Perforce Software, Inc.); Lucid Software Inc; Microsoft Corporation; Miro; Nulab Inc; and SmartDraw, LLC among others.
The Asia Pacific Diagramming Software Market is valued at US$ 162.61 Million in 2021, it is projected to reach US$ 356.26 Million by 2028.
As per our report Asia Pacific Diagramming Software Market, the market size is valued at US$ 162.61 Million in 2021, projecting it to reach US$ 356.26 Million by 2028. This translates to a CAGR of approximately 11.9% during the forecast period.
The Asia Pacific Diagramming Software Market report typically cover these key segments-
The historic period, base year, and forecast period can vary slightly depending on the specific market research report. However, for the Asia Pacific Diagramming Software Market report:
The Asia Pacific Diagramming Software Market is populated by several key players, each contributing to its growth and innovation. Some of the major players include:
The Asia Pacific Diagramming Software Market report is valuable for diverse stakeholders, including:
Essentially, anyone involved in or considering involvement in the Asia Pacific Diagramming Software Market value chain can benefit from the information contained in a comprehensive market report.
Office No. 1011, First floor, Farena Corporate Park, Magarpatta-Mundhwa road, Pune - 411028, Maharashtra, India
US:+16467917070
sales@businessmarketinsights.com


 Get Free Sample For Asia Pacific Diagramming Software Market
