Africa Revenue Assurance Market Forecast to 2030 - Regional Analysis - by Component (Solution and Services), Deployment (On-Premise and Cloud-Based), Organization Size (SMEs and Large Enterprises), and Vertical (BFSI, Hospitality, Telecom, Utilities, and Others)

BMIRE00030346 | Pages: 90 | Technology, Media and Telecommunications | Jul 2024 | Type: Regional | Status: Published

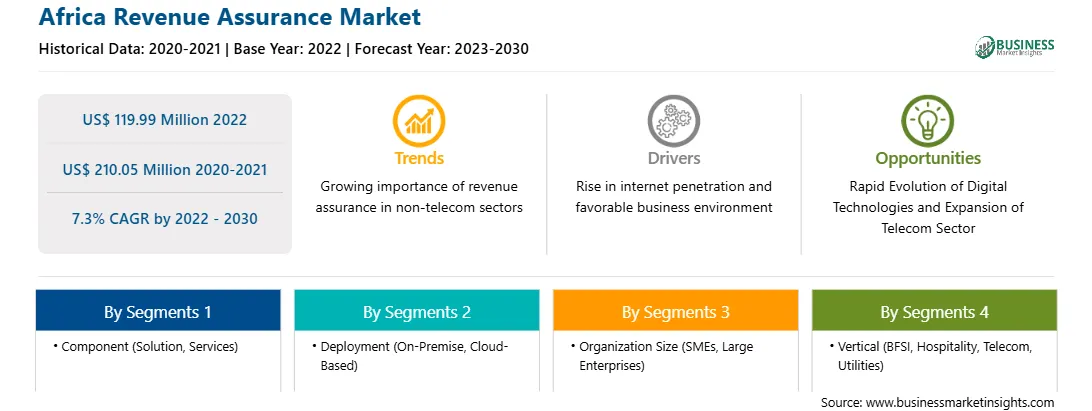
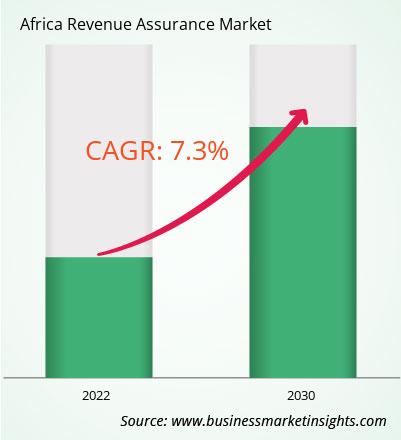
The Africa revenue assurance market was valued at US$ 119.99 million in 2022 and is expected to reach US$ 210.05 million by 2030; it is estimated to record a CAGR of 7.3% from 2022 to 2030.

Rise in Internet Penetration Fuels Africa Revenue Assurance Market

As internet usage continues to grow, more businesses are conducting their operations online, leading to an increase in the generation of digital transactions and revenue streams. According to World Bank data, globally, the number of individuals using the Internet in 2021 was 63%, an increase from 60% in 2020. With more people accessing the Internet, more digital transactions are taking place. This includes online purchases, digital payments, and other online financial activities. The larger the volume of transactions, the greater the need for effective revenue assurance measures to ensure accurate billing, prevent revenue leakages, and detect fraudulent activities. Moreover, the rise in internet penetration has fueled the growth of the e-commerce industry. Online retail platforms and marketplaces are experiencing increased activity, with more businesses and consumers participating in online buying and selling. Revenue assurance is crucial in ensuring accurate revenue recognition, managing inventory, and preventing revenue leakages in e-commerce. There is a significant increase in the use of mobile internet. As more people access the Internet through their mobile devices, there is a need for revenue assurance solutions that can effectively monitor and manage revenue streams from mobile services, such as mobile data, voice calls, and value-added services. Hence, the rising internet penetration is a significant driver for the revenue assurance market.

Africa Revenue Assurance Market Overview

The upsurge in mobile technology is one of the major factors propelling the revenue assurance industry growth in Africa. Mobile technology is set to play a crucial role in the way people live and businesses operate, enabling new digital solutions for both large and small enterprises and enhancing the support available to consumers through expanded online channels. The adoption of 4G technology has grown significantly in recent years, mainly due to the increasing demand for higher speeds, particularly among younger consumers. In the next five years, the adoption of 4G in Sub-Saharan Africa is projected to more than double, reaching a penetration rate of 45%. The momentum for 5G deployment is also gaining traction, with an initial focus on urban areas and industrial locations with greater demand for advanced connectivity. The introduction of 5G is expected to contribute US$ 11 billion to the Sub-Saharan African economy by 2030, accounting for over 6% of the overall economic impact of the mobile industry.

Africa Revenue Assurance Market Revenue and Forecast to 2030 (US$ Million)

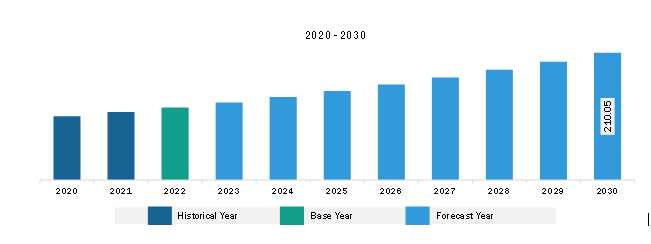
Get more information on this report :


Africa Revenue Assurance Market Segmentation 

The Africa revenue assurance market is categorized into components, deployment, organization size, vertical, and country.

Based on component, the Africa revenue assurance market is bifurcated into solution and services. The solution segment held a larger market share in 2022.

Based on deployment, the Africa revenue assurance market is bifurcated into on-premises and cloud-based. The cloud-based segment held a larger market share in 2022.

Based on organization size, the Africa revenue assurance market is bifurcated into SMEs and large enterprises. The large enterprises segment held a larger market share in 2022.

Based on vertical, the Africa revenue assurance market is categorized into BFSI, hospitality, telecom, utilities, and others. The telecom segment held the largest market share in 2022.

By country, the Africa revenue assurance market is segmented into the Northern Africa, Western Africa, Southern Africa, Eastern Africa, and Central Africa. Northern Africa dominated the Africa revenue assurance market share in 2022.

Nokia Corp, Tata Consultancy Services Ltd, Amdocs, BDO South Africa Inc, Araxxe SAS, Panamax Inc, and Adapt IT Holding Proprietary Ltd are some of the leading companies operating in the Africa revenue assurance market.

TABLE OF CONTENTS


1. Introduction

1.1 The Insight Partners Research Report Guidance

1.2 Market Segmentation

2. Executive Summary

2.1 Key Insights

2.2 Market Attractiveness

3. Research Methodology

3.1 Coverage

3.2 Secondary Research

3.3 Primary Research

4. Africa Revenue Assurance Market Landscape

4.1 Overview

4.2 PEST Analysis

4.3 Ecosystem Analysis

4.3.1 Solution Providers:

4.3.2 Service Providers

4.3.3 End Users:

4.3.4 List of Vendors in the Value Chain

5. Africa Revenue Assurance Market - Key Market Dynamics

5.1 Drivers

5.1.1 Rise in Internet Penetration

5.1.2 Favorable Business Environment

5.2 Restraints

5.2.1 Lack of Awareness and Understanding of Revenue Assurance

5.2.2 Organizational Management Issues

5.3 Opportunity

5.3.1 Rapid Evolution of Digital Technologies

5.4 Future Trends

5.4.1 Growing Importance of Revenue Assurance in Non-Telecom Sectors

5.5 Impact of Drivers and Restraints:

6. Revenue Assurance Market - Africa Market Analysis

6.1 Revenue Assurance Market Revenue (US$ Million), 2020-2030

6.2 Revenue Assurance Market Forecast Analysis

7. Africa Revenue Assurance Market Analysis - by Component

7.1 Solution

7.1.1 Overview

7.1.2 Solution: Revenue Assurance Market - Revenue and Forecast to 2030 (US$ Million)

7.2 Services

7.2.1 Overview

7.2.2 Services: Revenue Assurance Market - Revenue and Forecast to 2030 (US$ Million)

8. Africa Revenue Assurance Market Analysis - by Deployment

8.1 On-premise

8.1.1 Overview

8.1.2 On-premise: Revenue Assurance Market - Revenue and Forecast to 2030 (US$ Million)

8.2 Cloud-based

8.2.1 Overview

8.2.2 Cloud-based: Revenue Assurance Market - Revenue and Forecast to 2030 (US$ Million)

9. Africa Revenue Assurance Market Analysis - by Organization Size

9.1 SMEs

9.1.1 Overview

9.1.2 SMEs: Revenue Assurance Market - Revenue and Forecast to 2030 (US$ Million)

9.2 Large Enterprises

9.2.1 Overview

9.2.2 Large Enterprises: Revenue Assurance Market - Revenue and Forecast to 2030 (US$ Million)

10. Africa Revenue Assurance Market Analysis - by Vertical

10.1 BFSI

10.1.1 Overview

10.1.2 BFSI: Revenue Assurance Market - Revenue and Forecast to 2030 (US$ Million)

10.2 Hospitality

10.2.1 Overview

10.2.2 Hospitality: Revenue Assurance Market - Revenue and Forecast to 2030 (US$ Million)

10.3 Telecom

10.3.1 Overview

10.3.2 Telecom: Revenue Assurance Market - Revenue and Forecast to 2030 (US$ Million)

10.4 Utilities

10.4.1 Overview

10.4.2 Utilities: Revenue Assurance Market - Revenue and Forecast to 2030 (US$ Million)

10.5 Others

10.5.1 Overview

10.5.2 Others: Revenue Assurance Market - Revenue and Forecast to 2030 (US$ Million)

11. Africa Revenue Assurance Market - Country Analysis

11.1 Africa Revenue Assurance Market Overview

11.1.1 Africa: Revenue Assurance Market - Revenue and Forecast Analysis - by Country

11.1.1.1 Africa: Revenue Assurance Market - Revenue and Forecast Analysis - by Country

11.1.1.2 Northern Africa: Revenue Assurance Market - Revenue and Forecast to 2030 (US$ Million)

11.1.1.2.1 Northern Africa: Revenue Assurance Market Breakdown, by Component

11.1.1.2.2 Northern Africa: Revenue Assurance Market Breakdown, by Deployment

11.1.1.2.3 Northern Africa: Revenue Assurance Market Breakdown, by Organization Size

11.1.1.2.4 Northern Africa: Revenue Assurance Market Breakdown, by Vertical

11.1.1.3 Western Africa: Revenue Assurance Market - Revenue and Forecast to 2030 (US$ Million)

11.1.1.3.1 Western Africa: Revenue Assurance Market Breakdown, by Component

11.1.1.3.2 Western Africa: Revenue Assurance Market Breakdown, by Deployment

11.1.1.3.3 Western Africa: Revenue Assurance Market Breakdown, by Organization Size

11.1.1.3.4 Western Africa: Revenue Assurance Market Breakdown, by Vertical

11.1.1.4 Southern Africa: Revenue Assurance Market - Revenue and Forecast to 2030 (US$ Million)

11.1.1.4.1 Southern Africa: Revenue Assurance Market Breakdown, by Component

11.1.1.4.2 Southern Africa: Revenue Assurance Market Breakdown, by Deployment

11.1.1.4.3 Southern Africa: Revenue Assurance Market Breakdown, by Organization Size

11.1.1.4.4 Southern Africa: Revenue Assurance Market Breakdown, by Vertical

11.1.1.5 Eastern Africa: Revenue Assurance Market - Revenue and Forecast to 2030 (US$ Million)

11.1.1.5.1 Eastern Africa: Revenue Assurance Market Breakdown, by Component

11.1.1.5.2 Eastern Africa: Revenue Assurance Market Breakdown, by Deployment

11.1.1.5.3 Eastern Africa: Revenue Assurance Market Breakdown, by Organization Size

11.1.1.5.4 Eastern Africa: Revenue Assurance Market Breakdown, by Vertical

11.1.1.6 Central Africa: Revenue Assurance Market - Revenue and Forecast to 2030 (US$ Million)

11.1.1.6.1 Central Africa: Revenue Assurance Market Breakdown, by Component

11.1.1.6.2 Central Africa: Revenue Assurance Market Breakdown, by Deployment

11.1.1.6.3 Central Africa: Revenue Assurance Market Breakdown, by Organization Size

11.1.1.6.4 Central Africa: Revenue Assurance Market Breakdown, by Vertical

12. Competitive Landscape

12.1 Heat Map Analysis by Key Players

12.2 Company Positioning & Concentration

13. Industry Landscape

13.1 Overview

13.2 Market Initiative

13.3 Mergers & Acquisitions

14. Company Profiles

14.1 Nokia Corp

14.1.1 Key Facts

14.1.2 Business Description

14.1.3 Products and Services

14.1.4 Financial Overview

14.1.5 SWOT Analysis

14.1.6 Key Developments

14.2 Tata Consultancy Services Ltd

14.2.1 Key Facts

14.2.2 Business Description

14.2.3 Products and Services

14.2.4 Financial Overview

14.2.5 SWOT Analysis

14.2.6 Key Developments

14.3 Amdocs Ltd

14.3.1 Key Facts

14.3.2 Business Description

14.3.3 Products and Services

14.3.4 Financial Overview

14.3.5 SWOT Analysis

14.3.6 Key Developments

14.4 Araxxe SAS

14.4.1 Key Facts

14.4.2 Business Description

14.4.3 Products and Services

14.4.4 Financial Overview

14.4.5 SWOT Analysis

14.4.6 Key Developments

14.5 BDO South Africa Inc

14.5.1 Key Facts

14.5.2 Business Description

14.5.3 Products and Services

14.5.4 Financial Overview

14.5.5 SWOT Analysis

14.5.6 Key Developments

14.6 Panamax Inc

14.6.1 Key Facts

14.6.2 Business Description

14.6.3 Products and Services

14.6.4 Financial Overview

14.6.5 SWOT Analysis

14.6.6 Key Developments

14.7 Adapt IT Holdings Proprietary Ltd

14.7.1 Key Facts

14.7.2 Business Description

14.7.3 Products and Services

14.7.4 Financial Overview

14.7.5 SWOT Analysis

14.7.6 Key Developments

15. Appendix

15.1 About The Insight Partners

15.2 Word Index

List of Tables

Table 1. Revenue Assurance Market Segmentation

Table 2. List of Vendors

Table 3. Revenue Assurance Market - Revenue and Forecast to 2030 (US$ Million)

Table 4. Revenue Assurance Market - Revenue and Forecast to 2030 (US$ Million) - by Component

Table 5. Revenue Assurance Market - Revenue and Forecast to 2030 (US$ Million) - by Deployment

Table 6. Revenue Assurance Market - Revenue and Forecast to 2030 (US$ Million) - by Organization Size

Table 7. Revenue Assurance Market - Revenue and Forecast to 2030 (US$ Million) - by Vertical

Table 8. Africa: Revenue Assurance Market - Revenue and Forecast to 2030 (US$ Million) - by Country

Table 9. Northern Africa: Revenue Assurance Market - Revenue and Forecast to 2030 (US$ Million) - by Component

Table 10. Northern Africa: Revenue Assurance Market - Revenue and Forecast to 2030 (US$ Million) - by Deployment

Table 11. Northern Africa: Revenue Assurance Market - Revenue and Forecast to 2030 (US$ Million) - by Organization Size

Table 12. Northern Africa: Revenue Assurance Market - Revenue and Forecast to 2030 (US$ Million) - by Vertical

Table 13. Western Africa: Revenue Assurance Market - Revenue and Forecast to 2030 (US$ Million) - by Component

Table 14. Western Africa: Revenue Assurance Market - Revenue and Forecast to 2030 (US$ Million) - by Deployment

Table 15. Western Africa: Revenue Assurance Market - Revenue and Forecast to 2030 (US$ Million) - by Organization Size

Table 16. Western Africa: Revenue Assurance Market - Revenue and Forecast to 2030 (US$ Million) - by Vertical

Table 17. Southern Africa: Revenue Assurance Market - Revenue and Forecast to 2030 (US$ Million) - by Component

Table 18. Southern Africa: Revenue Assurance Market - Revenue and Forecast to 2030 (US$ Million) - by Deployment

Table 19. Southern Africa: Revenue Assurance Market - Revenue and Forecast to 2030 (US$ Million) - by Organization Size

Table 20. Southern Africa: Revenue Assurance Market - Revenue and Forecast to 2030 (US$ Million) - by Vertical

Table 21. Eastern Africa: Revenue Assurance Market - Revenue and Forecast to 2030 (US$ Million) - by Component

Table 22. Eastern Africa: Revenue Assurance Market - Revenue and Forecast to 2030 (US$ Million) - by Deployment

Table 23. Eastern Africa: Revenue Assurance Market - Revenue and Forecast to 2030 (US$ Million) - by Organization Size

Table 24. Eastern Africa: Revenue Assurance Market - Revenue and Forecast to 2030 (US$ Million) - by Vertical

Table 25. Central Africa: Revenue Assurance Market - Revenue and Forecast to 2030 (US$ Million) - by Component

Table 26. Central Africa: Revenue Assurance Market - Revenue and Forecast to 2030 (US$ Million) - by Deployment

Table 27. Central Africa: Revenue Assurance Market - Revenue and Forecast to 2030 (US$ Million) - by Organization Size

Table 28. Central Africa: Revenue Assurance Market - Revenue and Forecast to 2030 (US$ Million) - by Vertical

Table 29. Heat Map Analysis

Table 30. List of Abbreviation

List of Figures

Figure 1. Revenue Assurance Market Segmentation, by Regions

Figure 2. PEST Analysis

Figure 3. Ecosystem Analysis

Figure 4. Revenue Assurance Market - Key Market Dynamics

Figure 5. Impact Analysis of Drivers and Restraints

Figure 6. Revenue Assurance Market Revenue (US$ Million), 2020-2030

Figure 7. Revenue Assurance Market Share (%) - by Component (2022 and 2030)

Figure 8. Solution: Revenue Assurance Market - Revenue and Forecast to 2030 (US$ Million)

Figure 9. Services: Revenue Assurance Market - Revenue and Forecast to 2030 (US$ Million)

Figure 10. Revenue Assurance Market Share (%) - by Deployment (2022 and 2030)

Figure 11. On-premise: Revenue Assurance Market - Revenue and Forecast to 2030 (US$ Million)

Figure 12. Cloud-based: Revenue Assurance Market - Revenue and Forecast to 2030 (US$ Million)

Figure 13. Revenue Assurance Market Share (%) - by Organization Size (2022 and 2030)

Figure 14. SMEs: Revenue Assurance Market - Revenue and Forecast to 2030 (US$ Million)

Figure 15. Large Enterprises: Revenue Assurance Market - Revenue and Forecast to 2030 (US$ Million)

Figure 16. Revenue Assurance Market Share (%) - by Vertical (2022 and 2030)

Figure 17. BFSI: Revenue Assurance Market - Revenue and Forecast to 2030 (US$ Million)

Figure 18. Hospitality: Revenue Assurance Market - Revenue and Forecast to 2030 (US$ Million)

Figure 19. Telecom: Revenue Assurance Market - Revenue and Forecast to 2030 (US$ Million)

Figure 20. Utilities: Revenue Assurance Market - Revenue and Forecast to 2030 (US$ Million)

Figure 21. Others: Revenue Assurance Market - Revenue and Forecast to 2030 (US$ Million)

Figure 22. Africa: Revenue Assurance Market, by Key Regions - Revenue (2022) (US$ Million)

Figure 23. Africa: Revenue Assurance Market Breakdown, by Key Countries, 2022 and 2030 (%)

Figure 24. Northern Africa: Revenue Assurance Market - Revenue and Forecast to 2030 (US$ Million)

Figure 25. Western Africa: Revenue Assurance Market - Revenue and Forecast to 2030 (US$ Million)

Figure 26. Southern Africa: Revenue Assurance Market - Revenue and Forecast to 2030 (US$ Million)

Figure 27. Eastern Africa: Revenue Assurance Market - Revenue and Forecast to 2030 (US$ Million)

Figure 28. Central Africa: Revenue Assurance Market - Revenue and Forecast to 2030 (US$ Million)

Figure 29. Company Positioning & Concentration

1. Nokia Corp 
2. Tata Consultancy Services Ltd 
3. Amdocs 
4. Araxxe SAS 
5. BDO South Africa Inc 
6. Panamax Inc 
7. Adapt IT Holdings Proprietary Ltd 

  • Save and reduce time carrying out entry-level research by identifying the growth, size, leading players, and segments in the Africa revenue assurance market.
  • Highlights key business priorities in order to assist companies to realign their business strategies.
  • The key findings and recommendations highlight crucial progressive industry trends in the Africa revenue assurance market, thereby allowing players across the value chain to develop effective long-term strategies.
  • Develop/modify business expansion plans by using substantial growth offering developed and emerging markets.
  • Scrutinize in-depth Africa market trends and outlook coupled with the factors driving the Africa revenue assurance market, as well as those hindering it.
  • Enhance the decision-making process by understanding the strategies that underpin commercial interest with respect to client products, segmentation, pricing, and distribution.
Report Code
Full Name
Country Name
Email Id
Phone Number
Job Title
Company
Requirement

Note : Your data will never be shared with third parties, however, we may send you information from time to time about our products that may be of interest to you. By submitting your details, you agree to be contacted by us. You may contact us at any time to opt-out.


Purchase Options
Single User License
$3550
$2840
Site License
$4550
$3640
Enterprise License
$5550
$4440