Analysis - by Component (Solution and Services), Deployment (On-Premise and Cloud-Based), Organization Size (SMEs and Large Enterprises), and Vertical (BFSI, Hospitality, Telecom, Utilities, and Others)
No. of Pages:90
Report Code:
BMIRE00030522
Category:
Technology, Media and Telecommunications
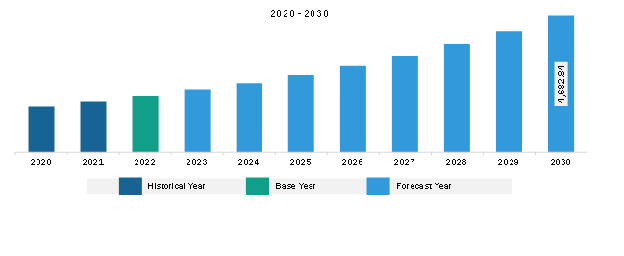
The North America revenue assurance market was valued at US$ 1,921.91 million in 2022 and is expected to reach US$ 4,682.84 million by 2030; it is estimated to record a CAGR of 11.8% from 2022 to 2030.
Favorable Business Environment Fuels North America Revenue Assurance Market
The revenue assurance market is experiencing significant growth, driven by factors such as favorable business environments and the provision of solid customer support. These factors contribute to developing and expanding revenue assurance solutions that help businesses optimize revenue streams, mitigate risks, and enhance operational efficiency. The emergence of favorable business environments is characterized by progressive regulatory frameworks, government support, and growing investor confidence. These factors have fostered a conducive atmosphere for businesses to flourish and expand their operations.
A favorable business environment encourages companies to invest in revenue assurance solutions to safeguard revenue streams, prevent financial leakages, and maintain compliance with regulatory requirements. Additionally, the availability of advanced technologies and infrastructure facilitates the implementation of revenue assurance measures, further boosting market growth. According to the International Monetary Fund, global economic growth is projected to stay at 3.1% in 2024 and rise to 3.2% in 2025. The growth is driven by comprehensive pro-business reforms and the adoption of advanced technologies, which positively impact the adoption of business-friendly initiatives such as revenue assurance solutions.
North America Revenue Assurance Market Overview
The North America revenue management market is segmented into the US, Canada, and Mexico. The revenue assurance market is experiencing consistent and promising growth in North America, driven by the increasing internet penetration. With more people accessing the internet, providers are offering a wider range of complex services-think streaming, cloud storage, bundled packages, and advanced mobile data plans. This complexity creates more opportunities for errors and revenue leakage, making robust revenue assurance solutions crucial. The US is highly investing in internet access. For instance, in June 2023, the White House announced that it would split US$ 42 billion among the nation's 50 states and territories to make access to high-speed broadband universal by 2030.
The growing digital transactions also drive the revenue assurance market. For instance, in February 2024, Visa, one of the global leaders in digital payments, announced extended digital wallet capabilities within Visa Commercial Pay, a suite of B2B payment solutions built in partnership with Conferma Pay, the world's foremost provider of virtual payments technology, to revolutionize how businesses manage transactions globally. In addition, in 2023, Bank of America clients connected with their finances more than 23.4 billion times through a combination of digital logins and proactive alerts-an 11% increase year over year and record. Clients received more than 10.6 billion proactive digital alerts in 2023-an increase of 12% year-over-year-giving them real-time insight into their financial lives. The Bank of America now has 57 million verified digital users, among which more than 35 million have opted to receive these alerts. Thus, increased internet use leads to more digital transactions, such as online payments, subscriptions, and micro-transactions. Each transaction carries the risk of errors and fraud, highlighting the need for efficient revenue assurance systems to identify and recover lost revenue. Therefore, the rise of internet penetration creates a dynamic and complex environment for businesses in North America. Revenue assurance solutions play a critical role in helping these businesses navigate this complexity, optimize their revenue, and stay competitive in the market.
North America Revenue Assurance Market Revenue and Forecast to 2030 (US$ Million)
North America Revenue Assurance Market Segmentation
Based on component, the North America revenue assurance market is bifurcated into solution and services. The solution segment held a larger market share in 2022.
In terms of deployment, the North America revenue assurance market is bifurcated into on-premises and cloud-based. The cloud-based segment held a larger market share in 2022.
By organization size, the North America revenue assurance market is bifurcated into SMEs and large enterprises. The large enterprises segment held a larger market share in 2022.
Based on vertical, the North America revenue assurance market is categorized into BFSI, hospitality, telecom, utilities, and others. The telecom segment held a larger market share in 2022.
By country, the North America revenue assurance market is segmented into the US, Canada, and Mexico. The US dominated the North America revenue assurance market share in 2022.
Cartesian Inc, Nokia Corp, Tata Consultancy Services Ltd, Amdocs, Subex, Araxxe SAS, LATRO Services Inc, Panamax Inc, and Adapt IT Holding Proprietary Ltd are some of the leading companies operating in the North America revenue assurance market.
North America Revenue Assurance Market Strategic Insights
Get more information on this report
North America Revenue Assurance Market Segmentation Analysis
North America Revenue Assurance Market Report Highlights
North America Revenue Assurance Report Scope
Report Attribute
Details
Market size in 2022
US$ 1,921.91 Million
Market Size by 2030
US$ 4,682.84 Million
CAGR (2022 - 2030)
11.8%
Historical Data
2020-2021
Forecast period
2023-2030
Segments Covered
By Component
Solution
Services
By Deployment
On-Premise
Cloud-Based
By Vertical
BFSI
Hospitality
Telecom
Utilities
Regions and Countries Covered
North America
US, Canada, Mexico
Market leaders and key company profiles
Cartesian Inc
Nokia Corp
Tata Consultancy Services Ltd
Amdocs
Subex Ltd
LATRO Services Inc
Araxxe SAS
Panamax Inc
Adapt IT Holdings Proprietary Ltd
Get more information on this report
North America Revenue Assurance Market Country and Regional Insights
Get more information on this report
Identical Market Reports with other Region/Countries
Siddhika is an experienced market research professional with over five years of expertise in delivering actionable market intelligence and strategic insights to support business growth and decision-making. She has strong experience in designing and managing end-to-end research engagements, including research planning, data collection, and insight generation.
Proficient in research methodologies, Siddhika synthesizes diverse information sources to deliver accurate, high-quality insights and strategic recommendations. She excels at translating complex market information into strategic narratives that support executive decision-making..
Show More
Frequently Asked Questions
How big is the North America Revenue Assurance Market?
The North America Revenue Assurance Market is valued at US$ 1,921.91 Million in 2022, it is projected to reach US$ 4,682.84 Million by 2030.
What is the CAGR for North America Revenue Assurance Market by (2022 - 2030)?
As per our report North America Revenue Assurance Market, the market size is valued at US$ 1,921.91 Million in 2022, projecting it to reach US$ 4,682.84 Million by 2030. This translates to a CAGR of approximately 11.8% during the forecast period.
What segments are covered in this report?
The North America Revenue Assurance Market report typically cover these key segments-
Component (Solution, Services)
Deployment (On-Premise, Cloud-Based)
Vertical (BFSI, Hospitality, Telecom, Utilities)
What is the historic period, base year, and forecast period taken for North America Revenue Assurance Market?
The historic period, base year, and forecast period can vary slightly depending on the specific market research report. However, for the North America Revenue Assurance Market report:
Historic Period : 2020-2021
Base Year : 2022
Forecast Period : 2023-2030
Who are the major players in North America Revenue Assurance Market?
The North America Revenue Assurance Market is populated by several key players, each contributing to its growth and innovation. Some of the major players include:
Cartesian Inc
Nokia Corp
Tata Consultancy Services Ltd
Amdocs
Subex Ltd
LATRO Services Inc
Araxxe SAS
Panamax Inc
Adapt IT Holdings Proprietary Ltd
Who should buy this report?
The North America Revenue Assurance Market report is valuable for diverse stakeholders, including:
Investors: Provides insights for investment decisions pertaining to market growth, companies, or industry insights. Helps assess market attractiveness and potential returns.
Industry Players: Offers competitive intelligence, market sizing, and trend analysis to inform strategic planning, product development, and sales strategies.
Suppliers and Manufacturers: Helps understand market demand for components, materials, and services related to concerned industry.
Researchers and Consultants: Provides data and analysis for academic research, consulting projects, and market studies.
Financial Institutions: Helps assess risks and opportunities associated with financing or investing in the concerned market.
Essentially, anyone involved in or considering involvement in the North America Revenue Assurance Market value chain can benefit from the information contained in a comprehensive market report.


 Get Free Sample For North America Revenue Assurance Market


