Analysis - by Operation (Transmission and Distribution), Equipment (Pipeline, Compressor Station, Metering Skids, and Others), and Application (Onshore and Offshore)
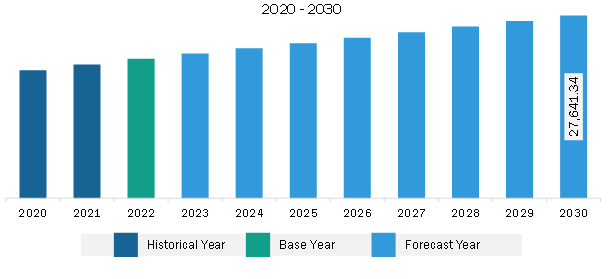
The North America gas pipeline infrastructure market is expected to grow from US$ 21,084.52 billion in 2022 to US$ 27,641.34 billion by 2030. It is estimated to record a CAGR of 3.4% from 2022 to 2030.
Growing Developments in the Offshore Gas Industry Fuel North America Gas Pipeline Infrastructure Market
Investment and focus on offshore gas pipeline infrastructure development are growing across the globe. For instance, in 2023, Trinidad and Tobago were given permission by the Biden administration to exploit a significant gas field situated in the Venezuelan territorial seas. Thus, growing investment for the development of offshore gas pipeline infrastructure is anticipated to fuel the growth of the gas pipeline infrastructure market during the forecast period.
North America Gas Pipeline Infrastructure Market Overview
North America is one of the leading gas exporters. The mounting demand for energy and the growing application of natural gas are boosting the market development of gas pipeline infrastructure in North America. In 2022, the US showcased the highest natural gas production capacity, followed by Canada and Mexico. Ixachi, Coulomb Phase 2, Quesqui, Nejo (IEPC), Leo, May, Koban, and Powerball are a few of the natural gas-producing fields in North America. The Ixachi plant is in Veracruz, Mexico, and it produced 618.09mmcfd (million cubic feet per day) in 2022. The Coulomb Phase 2 field is owned by Shell and located in the Central Planning Area, the US. The field produced 72.72mmcfd in 2022. Quesqui Field is in Tabasco, Mexico, and is operated by Petroleos Mexicanos. The field produced 485mmcfd in 2022. Also, the growing number of government initiatives and funding for the development of gas pipeline infrastructure is anticipated to boost the market for gas pipeline infrastructure over the forecast period. The natural gas pipeline network in the US is a substantially integrated network that transmits natural gas across the region. The pipeline infrastructure has ~3 million miles of mainline and other pipelines that connect natural gas production sites and storage facilities with primary consumers. In 2021, this natural gas transmission network carried approximately 27.6 trillion cubic feet of natural gas to ~77.7 million consumers. The US Gulf Coast is expected to register significant growth in prime gas infrastructure with over 20 LNG terminal projects and over 2,200 km of proposed or in-construction pipeline over the forecast period. Furthermore, during the Russia-Ukraine war, many countries discontinued their respective operations with Russian oil & gas businesses, which resulted in a shift of gas importers from Russia to the US. The following rise in demand of gas further augmented gas production operations across the US, which fuels the gas pipeline infrastructure market growth in the US.
North America Gas Pipeline Infrastructure Market Revenue and Forecast to 2030 (US$ Billion)
North America Gas Pipeline Infrastructure Market Segmentation
Based on operation, the North America gas pipeline infrastructure market is bifurcated into transmission and distribution. The distribution segment held a larger share of North America gas pipeline infrastructure market in 2022.
In terms of equipment, the North America gas pipeline infrastructure market is categorized into pipeline, compressor station, metering skids, and valves. The pipeline segment held the largest share of North America gas pipeline infrastructure market in 2022.
Based on application, the North America gas pipeline infrastructure market is bifurcated into onshore and offshore. The onshore segment held a larger share of North America gas pipeline infrastructure market in 2022.
Based on country, the North America gas pipeline infrastructure market is segmented into the US, Canada, and Mexico. The US dominated the North America gas pipeline infrastructure market in 2022.
Enbridge Inc, TC Energy Corp, Berkshire Hathaway Inc, Kinder Morgan Inc, and Pembina Pipeline Corp are some of the leading companies operating in the North America gas pipeline infrastructure market.
North America Gas Pipeline Infrastructure Market Strategic Insights
Get more information on this report
North America Gas Pipeline Infrastructure Market Segmentation Analysis
North America Gas Pipeline Infrastructure Market Report Highlights
North America Gas Pipeline Infrastructure Report Scope
Report Attribute
Details
Market size in 2022
US$ 21,084.52 Billion
Market Size by 2030
US$ 27,641.34 Billion
CAGR (2022 - 2030)
3.4%
Historical Data
2020-2021
Forecast period
2023-2030
Segments Covered
By Operation
Transmission and Distribution
By Equipment
Pipeline
Compressor Station
Metering Skids
Regions and Countries Covered
North America
US, Canada, Mexico
Market leaders and key company profiles
Enbridge Inc
TC Energy Corp
Berkshire Hathaway Inc
Kinder Morgan Inc
Pembina Pipeline Corp
Saipem SpA
Get more information on this report
North America Gas Pipeline Infrastructure Market Country and Regional Insights
Get more information on this report
Identical Market Reports with other Region/Countries
The List of Companies - North America Gas Pipeline Infrastructure Market
1. Enbridge Inc 2. TC Energy Corp 3. Berkshire Hathaway Inc 4. Kinder Morgan Inc 5. Pembina Pipeline Corp 6. Saipem SpA
Frequently Asked Questions
How big is the North America Gas Pipeline Infrastructure Market?
The North America Gas Pipeline Infrastructure Market is valued at US$ 21,084.52 Billion in 2022, it is projected to reach US$ 27,641.34 Billion by 2030.
What is the CAGR for North America Gas Pipeline Infrastructure Market by (2022 - 2030)?
As per our report North America Gas Pipeline Infrastructure Market, the market size is valued at US$ 21,084.52 Billion in 2022, projecting it to reach US$ 27,641.34 Billion by 2030. This translates to a CAGR of approximately 3.4% during the forecast period.
What segments are covered in this report?
The North America Gas Pipeline Infrastructure Market report typically cover these key segments-
What is the historic period, base year, and forecast period taken for North America Gas Pipeline Infrastructure Market?
The historic period, base year, and forecast period can vary slightly depending on the specific market research report. However, for the North America Gas Pipeline Infrastructure Market report:
Historic Period : 2020-2021
Base Year : 2022
Forecast Period : 2023-2030
Who are the major players in North America Gas Pipeline Infrastructure Market?
The North America Gas Pipeline Infrastructure Market is populated by several key players, each contributing to its growth and innovation. Some of the major players include:
Enbridge Inc
TC Energy Corp
Berkshire Hathaway Inc
Kinder Morgan Inc
Pembina Pipeline Corp
Saipem SpA
Who should buy this report?
The North America Gas Pipeline Infrastructure Market report is valuable for diverse stakeholders, including:
Investors: Provides insights for investment decisions pertaining to market growth, companies, or industry insights. Helps assess market attractiveness and potential returns.
Industry Players: Offers competitive intelligence, market sizing, and trend analysis to inform strategic planning, product development, and sales strategies.
Suppliers and Manufacturers: Helps understand market demand for components, materials, and services related to concerned industry.
Researchers and Consultants: Provides data and analysis for academic research, consulting projects, and market studies.
Financial Institutions: Helps assess risks and opportunities associated with financing or investing in the concerned market.
Essentially, anyone involved in or considering involvement in the North America Gas Pipeline Infrastructure Market value chain can benefit from the information contained in a comprehensive market report.


 Get Free Sample For North America Gas Pipeline Infrastructure Market


