analysis - by Component (Software and Service), Type (Descriptive Analytics, Predictive Analytics, and Prescriptive Analytics), Deployment (On-Premise and Cloud), and Application (Financial Management, Risk Management, Governance and Compliance Management, Supplier Sourcing and Performance Management, Demand and Supply Forecasting, and Others)
No. of Pages:82
Report Code:
BMIRE00030474
Category:
Technology, Media and Telecommunications
Middle East & Africa Spend Analytics for Electronics and Semiconductor Market
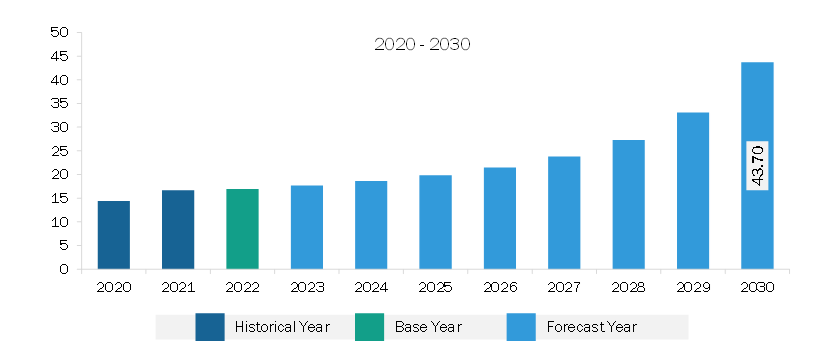
The Middle East & Africa spend analytics for electronics and semiconductor market was valued at US$ 16.98 million in 2022 and is expected to reach US$ 43.70 million by 2030; it is estimated to register a CAGR of 12.5% from 2022 to 2030.
Growing Implementation of AI-based Spend Analytics Bolsters Middle East & Africa Spend Analytics for Electronics and Semiconductor Market.
The integration of artificial intelligence (AI), generative AI, big data analytics, Internet of Things (IoT), cloud computing, robotic process automation (RPA), image recognition, and other technologies is expected to enhance the capabilities of spend analytics in the coming years. These technologies help automate data collection and analysis processes, provide predictive insights, optimize procurement strategies, and improve decision-making based on real-time data. In October 2023, SAP SE introduced new advancements in artificial intelligence (AI) and user experience within its comprehensive spend management and business network solutions at the SAP Spend Connect Live event, widely known as the leading conference in the field of spend management. These innovations are aimed at assisting customers in gaining control over costs, minimizing risk, and enhancing productivity. The technological advancements associated with spend analytics are driven by artificial intelligence (AI) integration. AI enables machines and software applications to reason, learn, and act like human cognition. This capability allows AI systems to analyze complicated data sets, recognize patterns, and make informed decisions based on the available information. The rise of AI technology has also led to an increased demand for powerful and efficient semiconductor chips. AI systems require high-performance computing capabilities to process and analyze large volumes of data in real time. This demand has driven the development of specialized AI chips optimized for AI workloads. Thus, the growing implementation of AI-based spend analytics is anticipated to create ample opportunities for the spend analytics for electronics and semiconductor market growth in the coming years.
Middle East & Africa Spend Analytics for Electronics and Semiconductor Market Overview
The increasing adoption of advanced technology-based devices, the proliferation of the automotive sector, and the rising demand for consumer electronics are a few of the noteworthy factors favoring the spend analytics for electronics and semiconductor market in the Middle East & Africa. The automotive sector in the region is contributing significantly to the market growth, as semiconductors are crucial components in vehicles. Further, people and businesses in the Middle East & Africa are highly inclined toward advanced electronic devices and technologies. The rising demand for consumer electronics is also a significant factor driving the adoption of spend analytics solutions in the electronics and semiconductor sector in the region. Businesses in the flourishing consumer electronics industry encounter the challenge of efficiently managing their expenditures to maintain competitiveness and meet their customers' changing preferences. Adopting spend analytics solutions becomes crucial as they provide valuable insights into spending patterns, identify opportunities for cost optimization, and facilitate informed decision-making, thereby ensuring that the companies remain adaptable and responsive in the fast-paced marketplace.
Middle East & Africa Spend Analytics for Electronics and Semiconductor Market Revenue and Forecast to 2030 (US$ Million)
Middle East & Africa Spend Analytics for Electronics and Semiconductor Market Segmentation
The Middle East & Africa spend analytics for electronics and semiconductor market is segmented based on component, type, deployment, application, and country. Based on component, the Middle East & Africa spend analytics for electronics and semiconductor market is bifurcated into software and services. The software services held a larger market share in 2022.
Based on type, the Middle East & Africa spend analytics for electronics and semiconductor market is segmented into descriptive analytics, predictive analytics, and prescriptive analytics. The predictive analytics held the largest market share in 2022.
In terms of deployment, the Middle East & Africa spend analytics for electronics and semiconductor market is bifurcated into on-premise and cloud. The cloud held a larger market share in 2022.
By application, the Middle East & Africa spend analytics for electronics and semiconductor market is segmented into financial management, risk management, governance & compliance management, supplier sourcing & performance management, demand & supply forecasting, and others. The supplier sourcing & performance management held the largest market share in 2022.
Based on country, the Middle East & Africa spend analytics for electronics and semiconductor market is segmented into South Africa, Saudi Arabia, the UAE, and the Rest of Middle East & Africa. The Rest of Middle East & Africa dominated the Middle East & Africa spend analytics for electronics and semiconductor market share in 2022.
Coupa Software Inc, International Business Machines Corp, Ivalua Inc, NB Ventures Inc, SAP SE, and Zycus Inc are some of the leading companies operating in the Middle East & Africa spend analytics for electronics and semiconductor market.
Middle East & Africa Spend Analytics for Electronics and Semiconductor Market Strategic Insights
Get more information on this report
Middle East & Africa Spend Analytics for Electronics and Semiconductor Market Segmentation Analysis
Middle East & Africa Spend Analytics for Electronics and Semiconductor Market Report Highlights
Middle East & Africa Spend Analytics for Electronics and Semiconductor Report Scope
Report Attribute
Details
Market size in 2022
US$ 16.98 Million
Market Size by 2030
US$ 43.70 Million
CAGR (2022 - 2030)
12.5%
Historical Data
2020-2021
Forecast period
2023-2030
Segments Covered
By Component
Software
Service
By Type
Descriptive Analytics
Predictive Analytics
Prescriptive Analytics
By Application
Financial Management
Risk Management
Governance and Compliance Management
Supplier Sourcing and Performance Management
Demand and Supply Forecasting
Regions and Countries Covered
Middle East and Africa
South Africa, Saudi Arabia, UAE, Rest of Middle East and Africa
Market leaders and key company profiles
Coupa Software Inc
International Business Machines Corp
Ivalua Inc
NB Ventures Inc
SAP SE
Zycus Inc
Get more information on this report
Middle East & Africa Spend Analytics for Electronics and Semiconductor Market Country and Regional Insights
Get more information on this report
Identical Market Reports with other Region/Countries
The List of Companies - Middle East & Africa Spend Analytics for Electronics and Semiconductor Market
1. Coupa Software Inc2. International Business Machines Corp3. Ivalua Inc4. NB Ventures Inc5. SAP SE6. Zycus Inc
Frequently Asked Questions
How big is the Middle East & Africa Spend Analytics for Electronics and Semiconductor Market?
The Middle East & Africa Spend Analytics for Electronics and Semiconductor Market is valued at US$ 16.98 Million in 2022, it is projected to reach US$ 43.70 Million by 2030.
What is the CAGR for Middle East & Africa Spend Analytics for Electronics and Semiconductor Market by (2022 - 2030)?
As per our report Middle East & Africa Spend Analytics for Electronics and Semiconductor Market, the market size is valued at US$ 16.98 Million in 2022, projecting it to reach US$ 43.70 Million by 2030. This translates to a CAGR of approximately 12.5% during the forecast period.
What segments are covered in this report?
The Middle East & Africa Spend Analytics for Electronics and Semiconductor Market report typically cover these key segments-
Component (Software, Service)
Type (Descriptive Analytics, Predictive Analytics, Prescriptive Analytics)
Application (Financial Management, Risk Management, Governance and Compliance Management, Supplier Sourcing and Performance Management, Demand and Supply Forecasting)
What is the historic period, base year, and forecast period taken for Middle East & Africa Spend Analytics for Electronics and Semiconductor Market?
The historic period, base year, and forecast period can vary slightly depending on the specific market research report. However, for the Middle East & Africa Spend Analytics for Electronics and Semiconductor Market report:
Historic Period : 2020-2021
Base Year : 2022
Forecast Period : 2023-2030
Who are the major players in Middle East & Africa Spend Analytics for Electronics and Semiconductor Market?
The Middle East & Africa Spend Analytics for Electronics and Semiconductor Market is populated by several key players, each contributing to its growth and innovation. Some of the major players include:
Coupa Software Inc
International Business Machines Corp
Ivalua Inc
NB Ventures Inc
SAP SE
Zycus Inc
Who should buy this report?
The Middle East & Africa Spend Analytics for Electronics and Semiconductor Market report is valuable for diverse stakeholders, including:
Investors: Provides insights for investment decisions pertaining to market growth, companies, or industry insights. Helps assess market attractiveness and potential returns.
Industry Players: Offers competitive intelligence, market sizing, and trend analysis to inform strategic planning, product development, and sales strategies.
Suppliers and Manufacturers: Helps understand market demand for components, materials, and services related to concerned industry.
Researchers and Consultants: Provides data and analysis for academic research, consulting projects, and market studies.
Financial Institutions: Helps assess risks and opportunities associated with financing or investing in the concerned market.
Essentially, anyone involved in or considering involvement in the Middle East & Africa Spend Analytics for Electronics and Semiconductor Market value chain can benefit from the information contained in a comprehensive market report.


 Get Free Sample For Middle East & Africa Spend Analytics for Electronics and Semiconductor Market


