2030년까지 유럽 사료 프리믹스 시장 예측 - 지역 분석 - 유형(비타민, 미네랄, 아미노산, 항생제, 항산화제, 혼합물 및 기타), 형태(건조 및 액체) 및 가축(가금류, 반추동물, 돼지, 양식업 및 기타)별 기타)
No. of Pages: 113 | Report Code: BMIRE00030167 | Category: Food and Beverages
No. of Pages: 113 | Report Code: BMIRE00030167 | Category: Food and Beverages
Strategic insights for Europe Feed Premix involve closely monitoring industry trends, consumer behaviours, and competitor actions to identify opportunities for growth. By leveraging data analytics, businesses can anticipate market shifts and make informed decisions that align with evolving customer needs. Understanding these dynamics helps companies adjust their strategies proactively, enhance customer engagement, and strengthen their competitive edge. Building strong relationships with stakeholders and staying agile in response to changes ensures long-term success in any market.
| Report Attribute | Details |
|---|---|
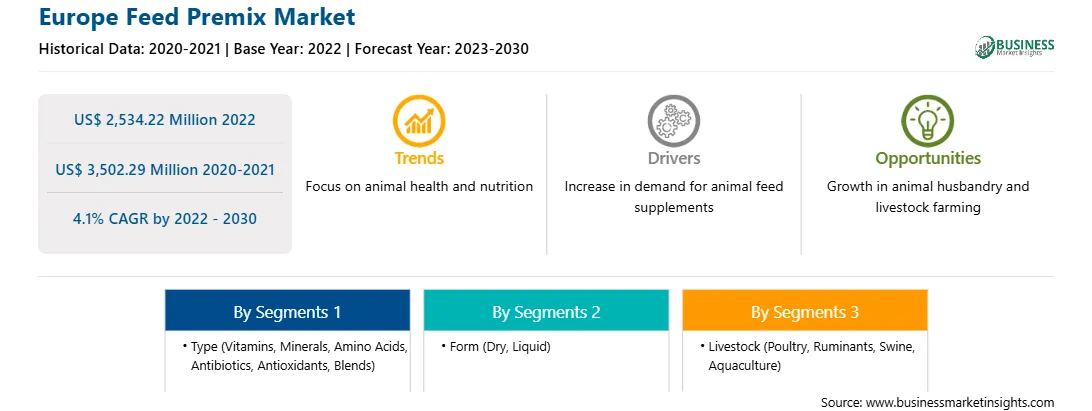
| Market size in 2022 | US$ 2,534.22 Million |
| Market Size by 2030 | US$ 3,502.29 Million |
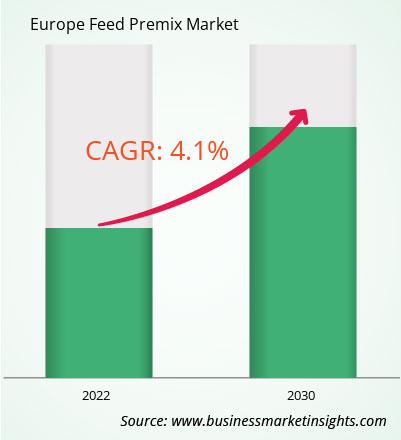
| Global CAGR (2022 - 2030) | 4.1% |
| Historical Data | 2020-2021 |
| Forecast period | 2023-2030 |
| Segments Covered |
By 유형
|
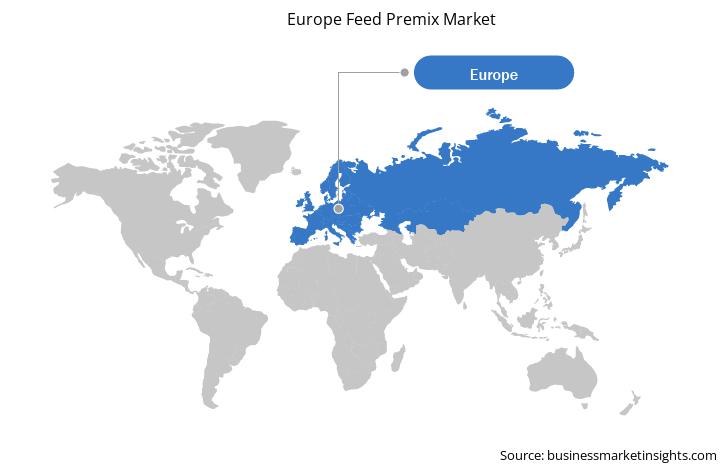
| Regions and Countries Covered | 유럽
|
| Market leaders and key company profiles |
The regional scope of Europe Feed Premix refers to the geographical area in which a business operates and competes. Understanding regional nuances, such as local consumer preferences, economic conditions, and regulatory environments, is crucial for tailoring strategies to specific markets. Businesses can expand their reach by identifying underserved regions or adapting their offerings to meet regional demands. A clear regional focus allows for more effective resource allocation, targeted marketing, and better positioning against local competitors, ultimately driving growth in those specific areas.
1. Agrifirm Group BV
2. Archer-Daniels-Midland Co
3. Cargill Inc
4. Danish Agro AMBA
5. Dansk Landbrugs Grovvareselskab amba
6. De Heus Voeders BV
7. Kemin Industries Inc
8. Koninklijke DSM NV
9. NuSana BV
10. Nutreco NV
The Europe Feed Premix Market is valued at US$ 2,534.22 Million in 2022, it is projected to reach US$ 3,502.29 Million by 2030.
As per our report Europe Feed Premix Market, the market size is valued at US$ 2,534.22 Million in 2022, projecting it to reach US$ 3,502.29 Million by 2030. This translates to a CAGR of approximately 4.1% during the forecast period.
The Europe Feed Premix Market report typically cover these key segments-
The historic period, base year, and forecast period can vary slightly depending on the specific market research report. However, for the Europe Feed Premix Market report:
The Europe Feed Premix Market is populated by several key players, each contributing to its growth and innovation. Some of the major players include:
The Europe Feed Premix Market report is valuable for diverse stakeholders, including:
Essentially, anyone involved in or considering involvement in the Europe Feed Premix Market value chain can benefit from the information contained in a comprehensive market report.
E 1803, Panchshil Towers, Vagholi, Haveli, Pune- 412207, Maharashtra, India
US:+16467917070
sales@businessmarketinsights.com


 Get Free Sample For Europe Feed Premix Market
