2030년까지 전자 및 반도체 시장 예측에 대한 아시아 태평양 지출 분석 - 지역 분석 - 구성 요소(소프트웨어 및 서비스), 유형(설명 분석, 예측 분석 및 처방 분석), 배포(온프레미스 및 클라우드) 및 애플리케이션(금융)별 관리, 위험 관리, 거버넌스 및 규정 준수 관리, 공급업체 소싱 및 성과 관리, 수요 및 공급 예측 등)

BMIRE00030385 | Pages: 96 | Electronics and Semiconductor | Jul 2024 | Type: Regional | Status: Published
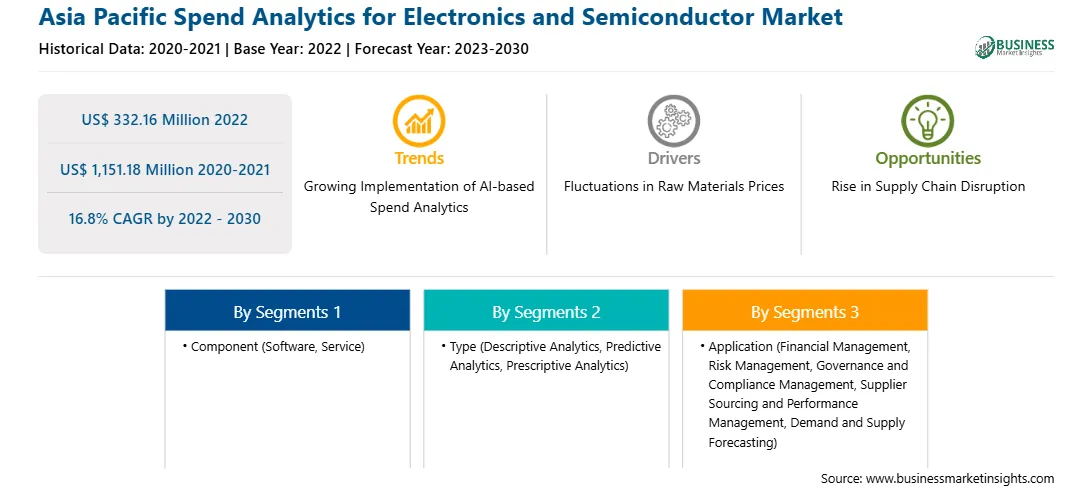
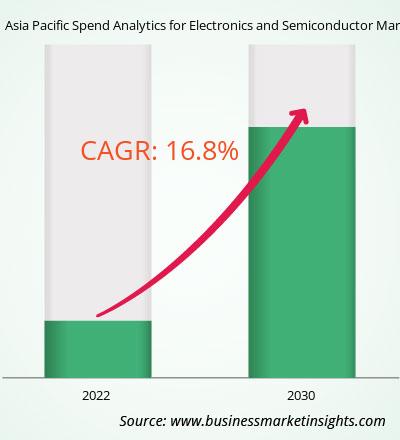
전자 및 반도체 시장에 대한 아시아 태평양 지출 분석은 2022년에 미화 3억 3,216만 달러로 평가되었으며 2030년까지 미화 11억 5,118만 달러에 이를 것으로 예상됩니다. 2022년부터 2030년까지 연평균 성장률(CAGR)은 16.8%로 예상됩니다.

소형화된 전자 장치의 통합으로 전자 및 반도체 시장에 대한 아시아 태평양 지출 분석이 향상됩니다.

마이크로칩, 센서 등 소형화된 전자 장치의 통합이 증가함에 따라 전자 및 반도체 부문에서 지출 분석을 사용해야 합니다. 기업은 비용 효율성을 보장하기 위해 부품, 재료, 제조 프로세스에 대한 지출을 효과적으로 관리해야 합니다. 마이크로프로세서 가격 하락, 메모리 용량 증가, 센서 개선, 디지털 카메라 픽셀의 발전 등 디지털 전자 제품의 발전은 지속적인 소형화 추세에 기인할 수 있습니다. 집적 회로는 전자 분야에 큰 영향을 미쳐 장치 소형화와 향상된 기능을 가능하게 했습니다. 전자 부품의 소형화 및 통합에 대한 요구와 함께 반도체 기술의 채택이 증가함에 따라 전자 및 반도체 산업에서 지출 분석에 대한 수요가 발생했습니다. 기업은 부품, 재료, 제조 공정에 대한 지출을 분석하여 비용 절감 솔루션을 파악하고, 공급망을 최적화하며, 소형 전자 장치 생산 시 비용 효율성을 보장할 수 있습니다. 따라서 소형화된 전자 장치의 통합은 예측 기간 동안 전자 및 반도체 시장 성장에 대한 지출 분석 기회를 창출할 것으로 예상됩니다.

전자 및 반도체 시장에 대한 아시아 태평양 지출 분석 개요

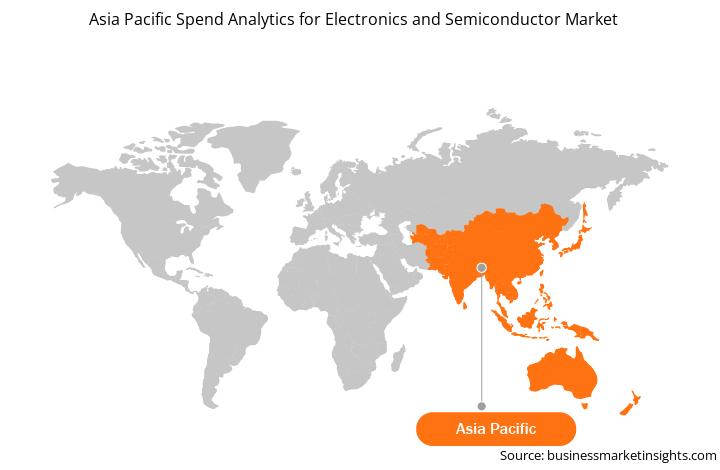
아시아 태평양 지역의 전자 및 반도체 시장에 대한 지출 분석은 향후 몇 년 동안 급속한 성장을 경험할 것으로 예상됩니다. 이 지역의 시장 발전은 소비자와 기업 사이에서 분석 도구의 수용이 증가했기 때문일 수 있습니다. 빅데이터 및 분석 부문은 아시아 태평양 지역에서 상당한 지출과 수익 성장을 목격하고 있습니다. 아시아 태평양 지역에서는 분석 도구 채택 증가, 빅 데이터 및 분석 부문의 성장, 통신, 은행, 중앙 정부, 개별 제조와 같은 산업의 특정 요구로 인해 지출 분석 소프트웨어에 대한 수요가 증가하고 있습니다. , 전문 서비스. 중국, 일본, 인도는 데이터 폭발, 도시화, 기계 학습 개발 및 많은 MSME로 인해 이 지역에서 지출 분석 채택의 최전선에 있습니다. 아시아 태평양 지역 전자 및 반도체 부문의 주요 기업으로는 PSMC(Powerchip Semiconductor Manufacturing Company), TSMC(Taiwan Semiconductor Manufacturing Company), UMC(United Microelectronics), VIS(Vanguard International Semiconductor) 등이 있습니다.

지출 분석을 채택하면 전자 및 반도체 시장의 조직은 구매 프로세스를 최적화하고 충분한 정보를 바탕으로 지출 결정을 내릴 수 있습니다. 지출 패턴을 분석함으로써 조직은 비용을 절감하고 공급업체를 효과적으로 관리하며 공급망 중단으로 인해 발생하는 위험을 완화할 수 있는 기회를 식별할 수 있습니다. 지출 분석은 지정학적 위협과 기타 글로벌 이벤트로 인해 아시아 태평양 지역에서 점점 더 널리 퍼지고 있는 공급망 중단을 해결하는 데에도 중요합니다. 최근 업계에 영향을 미친 반도체 부족 현상은 공급망 관리 개선의 필요성을 강조하고 있습니다. 지출 데이터를 면밀히 모니터링하고 분석함으로써 조직은 대체 공급업체를 식별하고 비용을 효과적으로 관리하며 전자 부품 및 반도체의 안정적인 공급을 보장할 수 있습니다.

전자 및 반도체 시장 수익에 대한 아시아 태평양 지출 분석 수익 및 2030년 예측(미화 백만 달러)

전자 및 반도체 시장 세분화에 대한 아시아 태평양 지출 분석

아시아 태평양 전자 및 반도체 시장에 대한 지출 분석은 구성 요소, 유형, 배포, 애플리케이션 및 국가를 기준으로 분류됩니다. 구성 요소를 기반으로 전자 및 반도체 시장에 대한 아시아 태평양 지출 분석은 소프트웨어와 서비스로 구분됩니다. 소프트웨어 서비스는 2022년에 더 큰 시장 점유율을 차지했습니다.

유형에 따라 전자 및 반도체 시장에 대한 아시아 태평양 지출 분석은 설명 분석, 예측 분석, 처방 분석으로 분류됩니다. 예측 분석은 2022년에 가장 큰 시장 점유율을 차지했습니다.

배포를 기준으로 아시아 태평양 지역의 전자 제품 및 반도체 시장에 대한 지출 분석은 온프레미스와 클라우드로 구분됩니다. 클라우드는 2022년에 더 큰 시장 점유율을 차지했습니다.

애플리케이션을 기반으로 전자 및 반도체 시장에 대한 아시아 태평양 지출 분석은 재무 관리, 위험 관리, 거버넌스 및 규정 준수 관리, 공급업체 소싱 및 성과 관리, 수요공급예측 등 공급업체 소싱 및 성과 관리는 2022년에 가장 큰 시장 점유율을 차지했습니다.

국가를 기준으로 전자 및 반도체 시장에 대한 아시아 태평양 지출 분석은 호주, 중국, 인도, 일본, 한국으로 분류되며, 아시아 태평양의 나머지 지역. 중국은 2022년 전자 및 반도체 시장 점유율에 대한 아시아 태평양 지출 분석을 장악했습니다.

Coupa Software Inc, International Business Machines Corp, Ivalua Inc, NB Ventures Inc, SAP SE, Scanmarket AS, Synertrade Inc, Zycus Inc 아시아 태평양 지역에서 활동하는 선도적인 기업 중 일부는 전자 및 반도체 시장에 대한 분석을 지출합니다.

TABLE OF CONTENTS


1. Introduction

1.1 The Insight Partners Research Report Guidance

1.2 Market Segmentation

2. Executive Summary

2.1 Key Insights

2.2 Market Attractiveness

3. Research Methodology

3.1 Coverage

3.2 Secondary Research

3.3 Primary Research

4. Asia Pacific Spend Analytics for Electronics and Semiconductor Market Landscape

4.1 Overview

4.2 Ecosystem Analysis

5. Asia Pacific Spend Analytics for Electronics and Semiconductor Market - Key Market Dynamics

5.1 Market Drivers

5.1.1 Fluctuations in Raw Materials Prices

5.1.2 Rise in Demand for Consumer Electronics

5.2 Market Restraints

5.2.1 Technological Complexity

5.3 Market Opportunities

5.3.1 Rise in Supply Chain Disruption

5.3.2 Incorporation of Miniaturized Electronic Devices

5.4 Future Trends

5.4.1 Growing Implementation of AI-based Spend Analytics

5.5 Impact of Drivers and Restraints:

6. Spend Analytics for Electronics and Semiconductor Market - Asia Pacific Market Analysis

6.1 Spend Analytics for Electronics and Semiconductor Market Revenue (US$ Million), 2020-2030

6.2 Spend Analytics for Electronics and Semiconductor Market Forecast Analysis

7. Asia Pacific Spend Analytics for Electronics and Semiconductor Market Analysis - by Component

7.1 Software

7.1.1 Overview

7.1.2 Software: Spend Analytics for Electronics and Semiconductor Market - Revenue and Forecast to 2030 (US$ Million)

7.2 Service

7.2.1 Overview

7.2.2 Service: Spend Analytics for Electronics and Semiconductor Market - Revenue and Forecast to 2030 (US$ Million)

8. Asia Pacific Spend Analytics for Electronics and Semiconductor Market Analysis - by Type

8.1 Descriptive Analytics

8.1.1 Overview

8.1.2 Descriptive Analytics: Spend Analytics for Electronics and Semiconductor Market - Revenue and Forecast to 2030 (US$ Million)

8.2 Predictive Analytics

8.2.1 Overview

8.2.2 Predictive Analytics: Spend Analytics for Electronics and Semiconductor Market - Revenue and Forecast to 2030 (US$ Million)

8.3 Prescriptive Analytics

8.3.1 Overview

8.3.2 Prescriptive Analytics: Spend Analytics for Electronics and Semiconductor Market - Revenue and Forecast to 2030 (US$ Million)

9. Asia Pacific Spend Analytics for Electronics and Semiconductor Market Analysis - by Deployment

9.1 On-Premise

9.1.1 Overview

9.1.2 On-Premise: Spend Analytics for Electronics and Semiconductor Market - Revenue and Forecast to 2030 (US$ Million)

9.2 Cloud

9.2.1 Overview

9.2.2 Cloud: Spend Analytics for Electronics and Semiconductor Market - Revenue and Forecast to 2030 (US$ Million)

10. Asia Pacific Spend Analytics for Electronics and Semiconductor Market Analysis - by Application

10.1 Financial Management

10.1.1 Overview

10.1.2 Financial Management: Spend Analytics for Electronics and Semiconductor Market - Revenue and Forecast to 2030 (US$ Million)

10.2 Risk Management

10.2.1 Overview

10.2.2 Risk Management: Spend Analytics for Electronics and Semiconductor Market - Revenue and Forecast to 2030 (US$ Million)

10.3 Governance and Compliance Management

10.3.1 Overview

10.3.2 Governance and Compliance Management: Spend Analytics for Electronics and Semiconductor Market - Revenue and Forecast to 2030 (US$ Million)

10.4 Supplier Sourcing and Performance Management

10.4.1 Overview

10.4.2 Supplier Sourcing and Performance Management: Spend Analytics for Electronics and Semiconductor Market - Revenue and Forecast to 2030 (US$ Million)

10.5 Demand and Supply Forecasting

10.5.1 Overview

10.5.2 Demand and Supply Forecasting: Spend Analytics for Electronics and Semiconductor Market - Revenue and Forecast to 2030 (US$ Million)

10.6 Others

10.6.1 Overview

10.6.2 Others: Spend Analytics for Electronics and Semiconductor Market - Revenue and Forecast to 2030 (US$ Million)

11. Asia Pacific Spend Analytics for Electronics and Semiconductor Market - Country Analysis

11.1 Asia Pacific Market Overview

11.1.1 Asia Pacific: Spend Analytics for Electronics and Semiconductor Market - Revenue and Forecast Analysis by Country

11.1.1.1 Asia Pacific: Spend Analytics for Electronics and Semiconductor Market - Revenue and Forecast Analysis - by Country

11.1.1.2 Australia: Spend Analytics for Electronics and Semiconductor Market - Revenue and Forecast to 2030 (US$ Million)

11.1.1.2.1 Australia: Spend Analytics for Electronics and Semiconductor Market Breakdown, by Component

11.1.1.2.2 Australia: Spend Analytics for Electronics and Semiconductor Market Breakdown, by Type

11.1.1.2.3 Australia: Spend Analytics for Electronics and Semiconductor Market Breakdown, by Deployment

11.1.1.2.4 Australia: Spend Analytics for Electronics and Semiconductor Market Breakdown, by Application

11.1.1.3 China: Spend Analytics for Electronics and Semiconductor Market - Revenue and Forecast to 2030 (US$ Million)

11.1.1.3.1 China: Spend Analytics for Electronics and Semiconductor Market Breakdown, by Component

11.1.1.3.2 China: Spend Analytics for Electronics and Semiconductor Market Breakdown, by Type

11.1.1.3.3 China: Spend Analytics for Electronics and Semiconductor Market Breakdown, by Deployment

11.1.1.3.4 China: Spend Analytics for Electronics and Semiconductor Market Breakdown, by Application

11.1.1.4 India: Spend Analytics for Electronics and Semiconductor Market - Revenue and Forecast to 2030 (US$ Million)

11.1.1.4.1 India: Spend Analytics for Electronics and Semiconductor Market Breakdown, by Component

11.1.1.4.2 India: Spend Analytics for Electronics and Semiconductor Market Breakdown, by Type

11.1.1.4.3 India: Spend Analytics for Electronics and Semiconductor Market Breakdown, by Deployment

11.1.1.4.4 India: Spend Analytics for Electronics and Semiconductor Market Breakdown, by Application

11.1.1.5 Japan: Spend Analytics for Electronics and Semiconductor Market - Revenue and Forecast to 2030 (US$ Million)

11.1.1.5.1 Japan: Spend Analytics for Electronics and Semiconductor Market Breakdown, by Component

11.1.1.5.2 Japan: Spend Analytics for Electronics and Semiconductor Market Breakdown, by Type

11.1.1.5.3 Japan: Spend Analytics for Electronics and Semiconductor Market Breakdown, by Deployment

11.1.1.5.4 Japan: Spend Analytics for Electronics and Semiconductor Market Breakdown, by Application

11.1.1.6 South Korea: Spend Analytics for Electronics and Semiconductor Market - Revenue and Forecast to 2030 (US$ Million)

11.1.1.6.1 South Korea: Spend Analytics for Electronics and Semiconductor Market Breakdown, by Component

11.1.1.6.2 South Korea: Spend Analytics for Electronics and Semiconductor Market Breakdown, by Type

11.1.1.6.3 South Korea: Spend Analytics for Electronics and Semiconductor Market Breakdown, by Deployment

11.1.1.6.4 South Korea: Spend Analytics for Electronics and Semiconductor Market Breakdown, by Application

11.1.1.7 Rest of Asia Pacific: Spend Analytics for Electronics and Semiconductor Market - Revenue and Forecast to 2030 (US$ Million)

11.1.1.7.1 Rest of Asia Pacific: Spend Analytics for Electronics and Semiconductor Market Breakdown, by Component

11.1.1.7.2 Rest of Asia Pacific: Spend Analytics for Electronics and Semiconductor Market Breakdown, by Type

11.1.1.7.3 Rest of Asia Pacific: Spend Analytics for Electronics and Semiconductor Market Breakdown, by Deployment

11.1.1.7.4 Rest of Asia Pacific: Spend Analytics for Electronics and Semiconductor Market Breakdown, by Application

12. Competitive Landscape

12.1 Heat Map Analysis by Key Players

12.2 Company Positioning & Concentration

13. Industry Landscape

13.1 Overview

13.2 Market Initiative

13.3 Product Development

13.4 Merger and Acquisition

14. Company Profiles

14.1 Coupa Software Inc

14.1.1 Key Facts

14.1.2 Business Description

14.1.3 Products and Services

14.1.4 Financial Overview

14.1.5 SWOT Analysis

14.1.6 Key Developments

14.2 International Business Machines Corp

14.2.1 Key Facts

14.2.2 Business Description

14.2.3 Products and Services

14.2.4 Financial Overview

14.2.5 SWOT Analysis

14.2.6 Key Developments

14.3 Ivalua Inc

14.3.1 Key Facts

14.3.2 Business Description

14.3.3 Products and Services

14.3.4 Financial Overview

14.3.5 SWOT Analysis

14.3.6 Key Developments

14.4 NB Ventures Inc

14.4.1 Key Facts

14.4.2 Business Description

14.4.3 Products and Services

14.4.4 Financial Overview

14.4.5 SWOT Analysis

14.4.6 Key Developments

14.5 SAP SE

14.5.1 Key Facts

14.5.2 Business Description

14.5.3 Products and Services

14.5.4 Financial Overview

14.5.5 SWOT Analysis

14.5.6 Key Developments

14.6 Scanmarket A/S

14.6.1 Key Facts

14.6.2 Business Description

14.6.3 Products and Services

14.6.4 Financial Overview

14.6.5 SWOT Analysis

14.6.6 Key Developments

14.7 Synertrade Inc

14.7.1 Key Facts

14.7.2 Business Description

14.7.3 Products and Services

14.7.4 Financial Overview

14.7.5 SWOT Analysis

14.7.6 Key Developments

14.8 Zycus Inc

14.8.1 Key Facts

14.8.2 Business Description

14.8.3 Products and Services

14.8.4 Financial Overview

14.8.5 SWOT Analysis

14.8.6 Key Developments

15. Appendix

15.1 Word Index

List of Tables

Table 1. Spend Analytics for Electronics and Semiconductor Market Segmentation

Table 2. Spend Analytics for Electronics and Semiconductor Market - Revenue and Forecast to 2030 (US$ Million)

Table 3. Spend Analytics for Electronics and Semiconductor Market - Revenue and Forecast to 2030 (US$ Million) - by Component

Table 4. Spend Analytics for Electronics and Semiconductor Market - Revenue and Forecast to 2030 (US$ Million) - by Type

Table 5. Spend Analytics for Electronics and Semiconductor Market - Revenue and Forecast to 2030 (US$ Million) - by Deployment

Table 6. Spend Analytics for Electronics and Semiconductor Market - Revenue and Forecast to 2030 (US$ Million) - by Application

Table 7. Asia Pacific: Spend Analytics for Electronics and Semiconductor Market - Revenue and Forecast to 2030 (US$ Million) - by Country

Table 8. Australia: Spend Analytics for Electronics and Semiconductor Market - Revenue and Forecast to 2030 (US$ Million) - by Component

Table 9. Australia: Spend Analytics for Electronics and Semiconductor Market - Revenue and Forecast to 2030 (US$ Million) - by Type

Table 10. Australia: Spend Analytics for Electronics and Semiconductor Market - Revenue and Forecast to 2030 (US$ Million) - by Deployment

Table 11. Australia: Spend Analytics for Electronics and Semiconductor Market - Revenue and Forecast to 2030 (US$ Million) - by Application

Table 12. China: Spend Analytics for Electronics and Semiconductor Market - Revenue and Forecast to 2030 (US$ Million) - by Component

Table 13. China: Spend Analytics for Electronics and Semiconductor Market - Revenue and Forecast to 2030 (US$ Million) - by Type

Table 14. China: Spend Analytics for Electronics and Semiconductor Market - Revenue and Forecast to 2030 (US$ Million) - by Deployment

Table 15. China: Spend Analytics for Electronics and Semiconductor Market - Revenue and Forecast to 2030 (US$ Million) - by Application

Table 16. India: Spend Analytics for Electronics and Semiconductor Market - Revenue and Forecast to 2030 (US$ Million) - by Component

Table 17. India: Spend Analytics for Electronics and Semiconductor Market - Revenue and Forecast to 2030 (US$ Million) - by Type

Table 18. India: Spend Analytics for Electronics and Semiconductor Market - Revenue and Forecast to 2030 (US$ Million) - by Deployment

Table 19. India: Spend Analytics for Electronics and Semiconductor Market - Revenue and Forecast to 2030 (US$ Million) - by Application

Table 20. Japan: Spend Analytics for Electronics and Semiconductor Market - Revenue and Forecast to 2030 (US$ Million) - by Component

Table 21. Japan: Spend Analytics for Electronics and Semiconductor Market - Revenue and Forecast to 2030 (US$ Million) - by Type

Table 22. Japan: Spend Analytics for Electronics and Semiconductor Market - Revenue and Forecast to 2030 (US$ Million) - by Deployment

Table 23. Japan: Spend Analytics for Electronics and Semiconductor Market - Revenue and Forecast to 2030 (US$ Million) - by Application

Table 24. South Korea: Spend Analytics for Electronics and Semiconductor Market - Revenue and Forecast to 2030 (US$ Million) - by Component

Table 25. South Korea: Spend Analytics for Electronics and Semiconductor Market - Revenue and Forecast to 2030 (US$ Million) - by Type

Table 26. South Korea: Spend Analytics for Electronics and Semiconductor Market - Revenue and Forecast to 2030 (US$ Million) - by Deployment

Table 27. South Korea: Spend Analytics for Electronics and Semiconductor Market - Revenue and Forecast to 2030 (US$ Million) - by Application

Table 28. Rest of Asia Pacific: Spend Analytics for Electronics and Semiconductor Market - Revenue and Forecast to 2030 (US$ Million) - by Component

Table 29. Rest of Asia Pacific: Spend Analytics for Electronics and Semiconductor Market - Revenue and Forecast to 2030 (US$ Million) - by Type

Table 30. Rest of Asia Pacific: Spend Analytics for Electronics and Semiconductor Market - Revenue and Forecast to 2030 (US$ Million) - by Deployment

Table 31. Rest of Asia Pacific: Spend Analytics for Electronics and Semiconductor Market - Revenue and Forecast to 2030 (US$ Million) - by Application

Table 32. Heat Map Analysis by Key Players

Table 33. List of Abbreviation

List of Figures

Figure 1. Spend Analytics for Electronics and Semiconductor Market Segmentation, by Country

Figure 2. Ecosystem: Spend Analytics for Electronics and Semiconductor Market

Figure 3. Spend Analytics for Electronics and Semiconductor Market - Key Market Dynamics

Figure 4. Impact Analysis of Drivers and Restraints

Figure 5. Spend Analytics for Electronics and Semiconductor Market Revenue (US$ Million), 2020-2030

Figure 6. Spend Analytics for Electronics and Semiconductor Market Share (%) - by Component (2022 and 2030)

Figure 7. Software: Spend Analytics for Electronics and Semiconductor Market - Revenue and Forecast to 2030 (US$ Million)

Figure 8. Service: Spend Analytics for Electronics and Semiconductor Market - Revenue and Forecast to 2030 (US$ Million)

Figure 9. Spend Analytics for Electronics and Semiconductor Market Share (%) - by Type (2022 and 2030)

Figure 10. Descriptive Analytics: Spend Analytics for Electronics and Semiconductor Market - Revenue and Forecast to 2030 (US$ Million)

Figure 11. Predictive Analytics: Spend Analytics for Electronics and Semiconductor Market - Revenue and Forecast to 2030 (US$ Million)

Figure 12. Prescriptive Analytics: Spend Analytics for Electronics and Semiconductor Market - Revenue and Forecast to 2030 (US$ Million)

Figure 13. Spend Analytics for Electronics and Semiconductor Market Share (%) - by Deployment (2022 and 2030)

Figure 14. On-Premise: Spend Analytics for Electronics and Semiconductor Market - Revenue and Forecast to 2030 (US$ Million)

Figure 15. Cloud: Spend Analytics for Electronics and Semiconductor Market - Revenue and Forecast to 2030 (US$ Million)

Figure 16. Spend Analytics for Electronics and Semiconductor Market Share (%) - by Application (2022 and 2030)

Figure 17. Financial Management: Spend Analytics for Electronics and Semiconductor Market - Revenue and Forecast to 2030 (US$ Million)

Figure 18. Risk Management: Spend Analytics for Electronics and Semiconductor Market - Revenue and Forecast to 2030 (US$ Million)

Figure 19. Governance and Compliance Management: Spend Analytics for Electronics and Semiconductor Market - Revenue and Forecast to 2030 (US$ Million)

Figure 20. Supplier Sourcing and Performance Management: Spend Analytics for Electronics and Semiconductor Market - Revenue and Forecast to 2030 (US$ Million)

Figure 21. Demand and Supply Forecasting: Spend Analytics for Electronics and Semiconductor Market - Revenue and Forecast to 2030 (US$ Million)

Figure 22. Others: Spend Analytics for Electronics and Semiconductor Market - Revenue and Forecast to 2030 (US$ Million)

Figure 23. Spend Analytics for Electronics and Semiconductor Market, by Key Countries - Revenue (2022) (US$ Million)

Figure 24. Asia Pacific: Spend Analytics for Electronics and Semiconductor Market Breakdown, by Key Countries, 2022 and 2030 (%)

Figure 25. Australia: Spend Analytics for Electronics and Semiconductor Market - Revenue and Forecast to 2030 (US$ Million)

Figure 26. China: Spend Analytics for Electronics and Semiconductor Market - Revenue and Forecast to 2030 (US$ Million)

Figure 27. India: Spend Analytics for Electronics and Semiconductor Market - Revenue and Forecast to 2030 (US$ Million)

Figure 28. Japan: Spend Analytics for Electronics and Semiconductor Market - Revenue and Forecast to 2030 (US$ Million)

Figure 29. South Korea: Spend Analytics for Electronics and Semiconductor Market - Revenue and Forecast to 2030 (US$ Million)

Figure 30. Rest of Asia Pacific: Spend Analytics for Electronics and Semiconductor Market - Revenue and Forecast to 2030 (US$ Million)

Figure 31. Company Positioning & Concentration

1. Coupa Software Inc
2. International Business Machines Corp
3. Ivalua Inc
4. NB Ventures Inc
5. SAP SE
6. Scanmarket AS
7. Synertrade Inc
8. Zycus Inc

  • Save and reduce time carrying out entry-level research by identifying the growth, size, leading players, and segments in the Asia Pacific spend analytics for electronics and semiconductor market.
  • Highlights key business priorities in order to assist companies to realign their business strategies.
  • The key findings and recommendations highlight crucial progressive industry trends in Asia Pacific spend analytics for electronics and semiconductor market, thereby allowing players across the value chain to develop effective long-term strategies.
  • Develop/modify business expansion plans by using substantial growth offering developed and emerging markets.
  • Scrutinize in-depth Asia Pacific market trends and outlook coupled with the factors driving the market, as well as those hindering it.
  • Enhance the decision-making process by understanding the strategies that underpin security interest with respect to client products, segmentation, pricing, and distribution.
Report Code
Full Name
Country Name
Email Id
Phone Number
Job Title
Company
Requirement

Note : Your data will never be shared with third parties, however, we may send you information from time to time about our products that may be of interest to you. By submitting your details, you agree to be contacted by us. You may contact us at any time to opt-out.


Purchase Options
Single User License
$3550
$2840
Site License
$4550
$3640
Enterprise License
$5550
$4440