Analysis - by Type (Step Indexed Optical Fiber and Graded Indexed Optical Fiber), Mode (Single Mode and Multi-Mode), Composition (Glass and Plastic), and End User (Telecom and Networking, Industrial Automation, Medical, Defense, and Others)
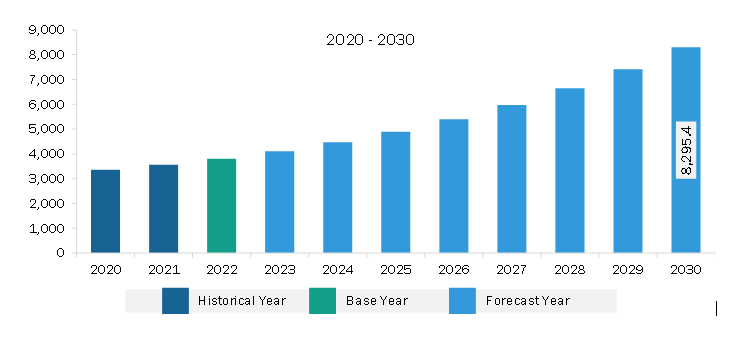
The Asia Pacific optical fiber market was valued at US$ 3,803.97 million in 2022 and is expected to reach US$ 8,295.43 million by 2030; it is estimated to record a CAGR of 10.2% from 2022 to 2030.
Adoption of Machine Learning (ML) and Artificial Intelligence (AI) Fuel the Asia Pacific Optical Fiber Market
The increasing advancement in Artificial Intelligence (AI) and Machine Learning (ML) technologies has opened up a world of possibilities across various industries. These transformative technologies are driving innovation, automation, and efficiency, presenting a unique opportunity for the optical fiber market. As AI and ML applications continue to increase, the demand for robust and high-speed data transmission becomes paramount. Optical fiber networks are well-suited to meet the requirements of AI and ML systems because of their ability to handle large volumes of data with minimal latency. These technologies heavily rely on the seamless and reliable transfer of data for real-time analytics, decision-making, and prediction capabilities. The low latency and high bandwidth offered by optical fiber networks enable the transfer of data with minimal delays, ensuring the efficiency and effectiveness of AI and ML algorithms.
Moreover, the increasing adoption of AI and ML in various industry verticals, such as healthcare, finance, manufacturing, and transportation, requires a strong foundation of connectivity. Optical fiber networks provide the necessary infrastructure to support the massive data transfers required by AI and ML applications. The high-speed capabilities of optical fiber enable the rapid transmission of data between servers, cloud platforms, and edge devices, facilitating the seamless operation of AI and ML. Additionally, as AI and ML applications become more sophisticated, the need for edge computing and decentralized data processing is growing. With their ability to connect remote locations and handle high-speed data transfers over long distances, optical fiber networks are essential for enabling efficient edge computing infrastructure. This enables real-time decision-making and reduces the dependence on centralized data centers, ensuring faster response times and improved overall performance for AI and ML systems.
Asia Pacific Optical Fiber Market Overview
Various countries in Asia Pacific are experiencing a dynamic shift toward the technologically advanced landscape with a key emphasis on projects in smart cities, such as the integration of the Internet of Things (IoT) and advancements of healthcare systems. Optical fiber supports these projects by offering a high speed and minimal latency for data transmission and communication in real-time. Furthermore, the increasing use of optical fiber connectors in the region is vital in facilitating reliable and high-speed communications interfaces, which in turn is driving the market.
One of the main factors propelling the market's expansion in Asia is the increasing use of fiber optic cables underwater. In addition to increasing network capacity and spectral efficiency, it has enhanced connectivity between nations. As the need for dependable connectivity and quick data transmission grows, underwater fiber optic cables will probably be utilized more frequently, which will help the regional market expand. For instance, the Asia-Africa-Europe 1 submarine (AAE-1) cable system connects several nations in Asia, the Middle East, Africa, and Europe over a distance of more than 25,000 kilometers. The deployment of the AAE-1 submarine cable system has greatly improved the area's use of deployed fiber. Furthermore, total fiber broadband in APAC accounted for more than 85.1% of the share of the residential fixed-line broadband subscriber base.
Asia Pacific Optical Fiber Market Revenue and Forecast to 2030 (US$ Million)
Asia Pacific Optical Fiber Market Segmentation
The Asia Pacific optical fiber market is segmented based on type, mode, composition, end user, and country. Based on type, the Asia Pacific optical fiber market is bifurcated into step indexed optical fiber and graded indexed optical fiber. The graded indexed optical fiber segment held a larger market share in 2022.
In terms of mode, the Asia Pacific optical fiber market is bifurcated into single mode and multi-mode. The single mode segment held a larger market share in 2022.
By composition the Asia Pacific optical fiber market is bifurcated into glass and plastic. The glass segment held a larger market share in 2022.
Based on end user, the Asia Pacific optical fiber market is categorized into the telecom and networking, industrial automation, medical, defense, and others. The telecom and networking segment held the largest market share in 2022.
Based on country, the Asia Pacific optical fiber market is segmented into Australia, China, India, Japan, South Korea, and the Rest of Asia Pacific. China dominated the Asia Pacific optical fiber market share in 2022.
Corning Inc, Prysmian Spa, Jiangsu Zhogtian Technology Co Ltd, Yangtze Optical Fiber and Cable Joint Stock Ltd, Fiberhome Telecommunication Technologies Co Ltd, CommScope Holding Co Inc, Nexans SA, Furukawa Electric Co Ltd, Sumitomo Electric Industries Ltd, and Coherent Corp are some of the leading companies operating in the Asia Pacific optical fiber market.
Asia Pacific Optical Fiber Market Strategic Insights
Get more information on this report
Asia Pacific Optical Fiber Market Segmentation Analysis
Asia Pacific Optical Fiber Market Report Highlights
Asia Pacific Optical Fiber Report Scope
Report Attribute
Details
Market size in 2022
US$ 3,803.97 Million
Market Size by 2030
US$ 8,295.43 Million
CAGR (2022 - 2030)
10.2%
Historical Data
2020-2021
Forecast period
2023-2030
Segments Covered
By Type
Step Indexed Optical Fiber
Graded Indexed Optical Fiber
By Mode
Single Mode
Multi-Mode
By Composition
Glass
Plastic
By End User
Telecom and Networking
Industrial Automation
Medical
Defense
Regions and Countries Covered
Asia-Pacific
China, India, Japan, Australia, Rest of Asia-Pacific
Market leaders and key company profiles
Corning Inc
Prysmian Spa
Jiangsu Zhogtian Technology Co Ltd
Yangtze Optical Fiber and Cable Joint Stock Ltd
Fiberhome Telecommunication Technologies Co Ltd
CommScope Holding Co Inc
Nexans SA
Furukawa Electric Co Ltd
Sumitomo Electric Industries Ltd
Coherent Corp
Get more information on this report
Asia Pacific Optical Fiber Market Country and Regional Insights
Get more information on this report
Identical Market Reports with other Region/Countries
The List of Companies - Asia Pacific Optical Fiber Market
1. Corning Inc2. Prysmian Spa3. Jiangsu Zhogtian Technology Co Ltd4. Yangtze Optical Fiber and Cable Joint Stock Ltd5. Fiberhome Telecommunication Technologies Co Ltd6. CommScope Holding Co Inc7. Nexans SA8. Furukawa Electric Co Ltd9. Sumitomo Electric Industries Ltd10. Coherent Corp
About Author— Electronics and Semiconductor Research Team
Siddhika is an experienced market research professional with over five years of expertise in delivering actionable market intelligence and strategic insights to support business growth and decision-making. She has strong experience in designing and managing end-to-end research engagements, including research planning, data collection, and insight generation.
Proficient in research methodologies, Siddhika synthesizes diverse information sources to deliver accurate, high-quality insights and strategic recommendations. She excels at translating complex market information into strategic narratives that support executive decision-making..
Show More
Frequently Asked Questions
How big is the Asia Pacific Optical Fiber Market?
The Asia Pacific Optical Fiber Market is valued at US$ 3,803.97 Million in 2022, it is projected to reach US$ 8,295.43 Million by 2030.
What is the CAGR for Asia Pacific Optical Fiber Market by (2022 - 2030)?
As per our report Asia Pacific Optical Fiber Market, the market size is valued at US$ 3,803.97 Million in 2022, projecting it to reach US$ 8,295.43 Million by 2030. This translates to a CAGR of approximately 10.2% during the forecast period.
What segments are covered in this report?
The Asia Pacific Optical Fiber Market report typically cover these key segments-
Type (Step Indexed Optical Fiber, Graded Indexed Optical Fiber)
Mode (Single Mode, Multi-Mode)
Composition (Glass, Plastic)
End User (Telecom and Networking, Industrial Automation, Medical, Defense)
What is the historic period, base year, and forecast period taken for Asia Pacific Optical Fiber Market?
The historic period, base year, and forecast period can vary slightly depending on the specific market research report. However, for the Asia Pacific Optical Fiber Market report:
Historic Period : 2020-2021
Base Year : 2022
Forecast Period : 2023-2030
Who are the major players in Asia Pacific Optical Fiber Market?
The Asia Pacific Optical Fiber Market is populated by several key players, each contributing to its growth and innovation. Some of the major players include:
Corning Inc
Prysmian Spa
Jiangsu Zhogtian Technology Co Ltd
Yangtze Optical Fiber and Cable Joint Stock Ltd
Fiberhome Telecommunication Technologies Co Ltd
CommScope Holding Co Inc
Nexans SA
Furukawa Electric Co Ltd
Sumitomo Electric Industries Ltd
Coherent Corp
Who should buy this report?
The Asia Pacific Optical Fiber Market report is valuable for diverse stakeholders, including:
Investors: Provides insights for investment decisions pertaining to market growth, companies, or industry insights. Helps assess market attractiveness and potential returns.
Industry Players: Offers competitive intelligence, market sizing, and trend analysis to inform strategic planning, product development, and sales strategies.
Suppliers and Manufacturers: Helps understand market demand for components, materials, and services related to concerned industry.
Researchers and Consultants: Provides data and analysis for academic research, consulting projects, and market studies.
Financial Institutions: Helps assess risks and opportunities associated with financing or investing in the concerned market.
Essentially, anyone involved in or considering involvement in the Asia Pacific Optical Fiber Market value chain can benefit from the information contained in a comprehensive market report.


 Get Free Sample For Asia Pacific Optical Fiber Market


