Analysis - by Source (Almond, Soy, Coconut, Oat, and Others), Type (Flavored and Plain), Nature (Organic and Conventional), and Distribution Channel (Supermarkets and Hypermarkets, Convenience Stores, Online Retail, and Others)
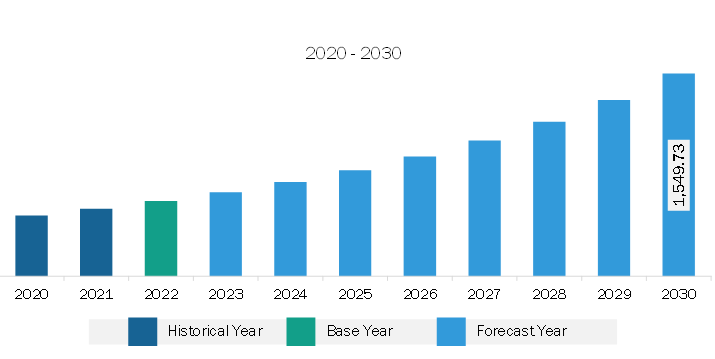
The Asia Pacific non-dairy yogurt market was valued at US$ 576.00 million in 2022 and is expected to reach US$ 1,549.73 million by 2030; it is estimated to grow at a CAGR of 13.2% from 2022 to 2030.
Strategic Development Initiatives by Manufacturers Fuels the Asia Pacific Non-Dairy Yogurt Market
Non-dairy yogurt manufacturers are making significant investments in product innovations to attract a large group of consumers. The manufacturers offer certified organic, non-GMO, gluten-free, clean-label, and allergen-free products to cater to emerging customer requirements. Moreover, as consumers have become health-conscious, they prefer low-calorie and low-fat products. Therefore, manufacturers of plant-based dairy offer unsweetened and low-sugar products. In February 2021, Halsa Foods launched zero-sugar oat milk yogurt in a 24 oz family size. The product contains only 90 calories per serving and has no added sugar. Also, in 2023, Yoghurt brand Coyo Pty Ltd has launched a new range of plant-based frozen yoghurt made with real fruit, and using coconut as its yoghurt base, in place of dairy.
Further, manufacturers are also launching products by incorporating different flavors and functional nutrients. In December 2020, Danone SA launched the Silk Kids Almond Milk Yogurt Alternative plant-based yogurts, specially formulated for kids. The product comprises fava beans protein, almond milk, live & active culture, and organic coconut oil. It is fortified with vitamin D and calcium to satisfy the children's nutrition. The yogurt substitute is dairy-free, lactose-free, gluten-free, and peanut-free. It is available in three flavors-apple cinnamon, strawberry, and mixed berry. Product innovation strategy offers a competitive edge to the players operating in the market and boosts their profitability, which propels the Asia Pacific non-dairy yogurt market growth.
Asia Pacific Non-Dairy Yogurt Market Overview
The non-dairy yogurt market in the Asia Pacific is segmented into Australia, China, India, Japan, South Korea, and the Rest of Asia Pacific. A few factors contributing to the demand for non-dairy yogurt in the region are a surge in health-conscious consumers in emerging countries and the rising trend of consuming plant-based dairy products. Non-dairy yogurts contain low-fat, low-calorie, and low-cholesterol content, appealing to health-conscious and lactose-intolerant customers. Moreover, a few people are vegan, while an increasing number of people are adopting "flexitarian" dietary patterns. Thus, this shift in customer preferences boosts the demand for dairy alternatives such as non-dairy yogurt.
In recent years, the consumption of non-dairy yogurt has steadily increased due to the growing number of lactose-intolerant people and health concerns regarding antibiotics and growth hormones often found in cows milk. The research conducted by Rakuten in 2021 showed that 87% of consumers in China had tried plant-based milk, 50% had tried other dairy substitutes, 42% had tried plant-based meat, and 32% had tried vegan egg replacements. Furthermore, the same research found that 3% of respondents only consume plant-based foods.
The non-dairy yogurt market in the Asia Pacific is significantly growing due to changing lifestyles of consumers and an increase in the consumption of clean-label products, organic, and gluten-free products. The market in the region is also undergoing a remarkable transformation due to increased urbanization, diet diversification, and the legalization of foreign direct investment in the food sector. Hence, manufacturers are adopting strategies for the development and expansion of their businesses. In 2020 Invigorate Foods announced its plan to invest US$ 8.4 million (INR 60 crores) in the next three years in plant, equipment, and other capital goods required for manufacturing soymilk products in India. Further, in 2019, The Blue Diamond announced its expansion into the non-dairy yogurt alternative category with almond breeze and almond milk yogurt alternatives. Similarly, food wholesaler and manufacturer Kokubu Food launched Japan's first almond-based yogurt in April 2020. Such developments by manufacturers boost the demand for non-dairy yogurt in Asia Pacific.
Asia Pacific Non-Dairy Yogurt Market Revenue and Forecast to 2030 (US$ Million)
Asia Pacific Non-Dairy Yogurt Market Segmentation
The Asia Pacific non-dairy yogurt market is segmented based on source, type, nature, and distribution channel.
Based on source, the Asia Pacific non-dairy yogurt market is segmented into almond, soy, coconut, oat, and others. The coconut segment held the largest share in 2022.
Based on type, the Asia Pacific non-dairy yogurt market is bifurcated into flavored and plain. The flavored segment held a larger share in 2022.
Based on nature, the Asia Pacific non-dairy yogurt market is bifurcated into organic and conventional. The conventional segment held a larger share in 2022.
Based on distribution channel, the Asia Pacific non-dairy yogurt market is segmented into supermarkets & hypermarkets, convenience stores, online retail, and others. The supermarkets & hypermarkets segment held the largest share in 2022.
Based on country, the Asia Pacific non-dairy yogurt market is categorized into Australia, China, India, Japan, South Korea, and the Rest of Asia Pacific. The Rest of Asia Pacific dominated the Asia Pacific non-dairy yogurt market in 2022.
The Hain Celestial Group Inc, Danone SA, COYO Pty Ltd, Valio Ltd, and Oatly Group AB are some of the leading companies operating in the Asia Pacific non-dairy yogurt market.
Asia Pacific Non-Dairy Yogurt Market Strategic Insights
Get more information on this report
Asia Pacific Non-Dairy Yogurt Market Segmentation Analysis
Asia Pacific Non-Dairy Yogurt Market Report Highlights
Asia Pacific Non-Dairy Yogurt Report Scope
Report Attribute
Details
Market size in 2022
US$ 576.00 Million
Market Size by 2030
US$ 1,549.73 Million
CAGR (2022 - 2030)
13.2%
Historical Data
2020-2021
Forecast period
2023-2030
Segments Covered
By Source
Almond
Soy
Coconut
Oat
By Type
Flavored
Plain
By Nature
Organic
Conventional
By Distribution Channel
Supermarkets and Hypermarkets
Convenience Stores
Online Retail
Regions and Countries Covered
Asia-Pacific
China, India, Japan, Australia, Rest of Asia-Pacific
Market leaders and key company profiles
The Hain Celestial Group Inc
Danone SA
COYO Pty Ltd
Valio Ltd
Oatly Group AB
Get more information on this report
Asia Pacific Non-Dairy Yogurt Market Country and Regional Insights
Get more information on this report
Identical Market Reports with other Region/Countries
The List of Companies - Asia Pacific Non-Dairy Yogurt Market
1. The Hain Celestial Group Inc 2. Danone SA 3. COYO Pty Ltd 4. Valio Ltd 5. Oatly Group AB
Frequently Asked Questions
How big is the Asia Pacific Non-Dairy Yogurt Market?
The Asia Pacific Non-Dairy Yogurt Market is valued at US$ 576.00 Million in 2022, it is projected to reach US$ 1,549.73 Million by 2030.
What is the CAGR for Asia Pacific Non-Dairy Yogurt Market by (2022 - 2030)?
As per our report Asia Pacific Non-Dairy Yogurt Market, the market size is valued at US$ 576.00 Million in 2022, projecting it to reach US$ 1,549.73 Million by 2030. This translates to a CAGR of approximately 13.2% during the forecast period.
What segments are covered in this report?
The Asia Pacific Non-Dairy Yogurt Market report typically cover these key segments-
Source (Almond, Soy, Coconut, Oat)
Type (Flavored, Plain)
Nature (Organic, Conventional)
Distribution Channel (Supermarkets and Hypermarkets, Convenience Stores, Online Retail)
What is the historic period, base year, and forecast period taken for Asia Pacific Non-Dairy Yogurt Market?
The historic period, base year, and forecast period can vary slightly depending on the specific market research report. However, for the Asia Pacific Non-Dairy Yogurt Market report:
Historic Period : 2020-2021
Base Year : 2022
Forecast Period : 2023-2030
Who are the major players in Asia Pacific Non-Dairy Yogurt Market?
The Asia Pacific Non-Dairy Yogurt Market is populated by several key players, each contributing to its growth and innovation. Some of the major players include:
The Hain Celestial Group Inc
Danone SA
COYO Pty Ltd
Valio Ltd
Oatly Group AB
Who should buy this report?
The Asia Pacific Non-Dairy Yogurt Market report is valuable for diverse stakeholders, including:
Investors: Provides insights for investment decisions pertaining to market growth, companies, or industry insights. Helps assess market attractiveness and potential returns.
Industry Players: Offers competitive intelligence, market sizing, and trend analysis to inform strategic planning, product development, and sales strategies.
Suppliers and Manufacturers: Helps understand market demand for components, materials, and services related to concerned industry.
Researchers and Consultants: Provides data and analysis for academic research, consulting projects, and market studies.
Financial Institutions: Helps assess risks and opportunities associated with financing or investing in the concerned market.
Essentially, anyone involved in or considering involvement in the Asia Pacific Non-Dairy Yogurt Market value chain can benefit from the information contained in a comprehensive market report.


 Get Free Sample For Asia Pacific Non-Dairy Yogurt Market


