2030년까지 아시아 태평양 그래픽 처리 장치(GPU) 시장 예측 - 지역 분석 - 유형(전용, 통합 및 하이브리드) 및 애플리케이션(태블릿, 컴퓨터, 스마트폰, 게임 콘솔, 텔레비전 및 기타)별
No. of Pages: 98 | Report Code: BMIRE00030233 | Category: Technology, Media and Telecommunications
No. of Pages: 98 | Report Code: BMIRE00030233 | Category: Technology, Media and Telecommunications
Strategic insights for Asia Pacific Graphics Processing Unit (GPU) involve closely monitoring industry trends, consumer behaviours, and competitor actions to identify opportunities for growth. By leveraging data analytics, businesses can anticipate market shifts and make informed decisions that align with evolving customer needs. Understanding these dynamics helps companies adjust their strategies proactively, enhance customer engagement, and strengthen their competitive edge. Building strong relationships with stakeholders and staying agile in response to changes ensures long-term success in any market.
| Report Attribute | Details |
|---|---|
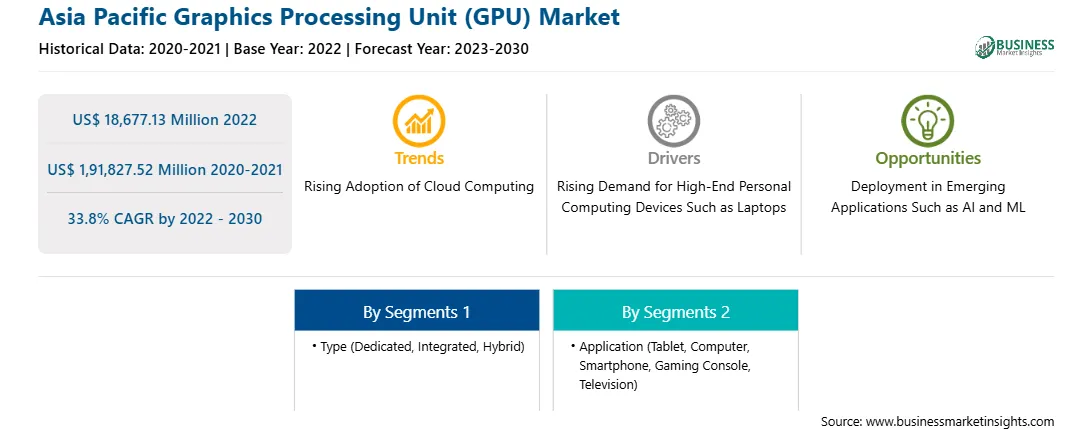
| Market size in 2022 | US$ 18,677.13 Million |
| Market Size by 2030 | US$ 1,91,827.52 Million |
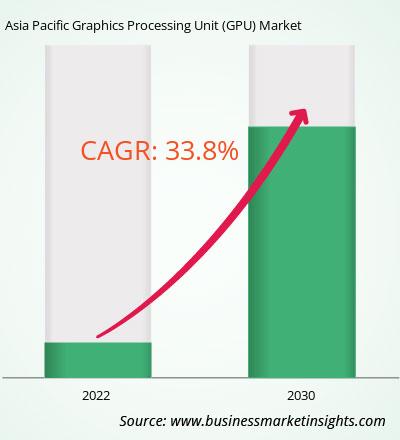
| Global CAGR (2022 - 2030) | 33.8% |
| Historical Data | 2020-2021 |
| Forecast period | 2023-2030 |
| Segments Covered |
By 유형
|
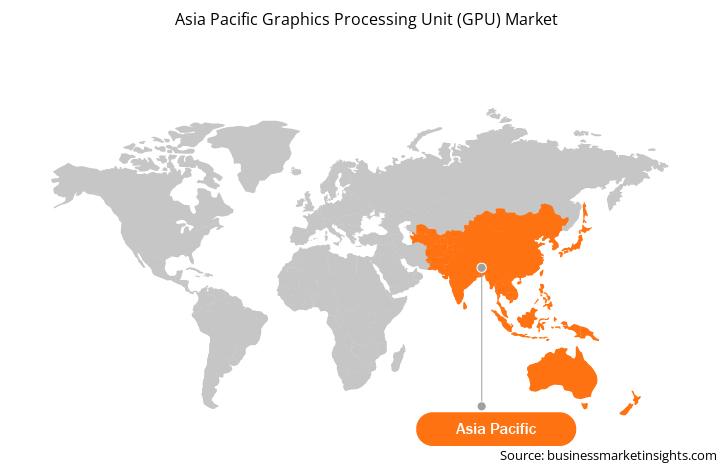
| Regions and Countries Covered | 아시아 태평양
|
| Market leaders and key company profiles |
The regional scope of Asia Pacific Graphics Processing Unit (GPU) refers to the geographical area in which a business operates and competes. Understanding regional nuances, such as local consumer preferences, economic conditions, and regulatory environments, is crucial for tailoring strategies to specific markets. Businesses can expand their reach by identifying underserved regions or adapting their offerings to meet regional demands. A clear regional focus allows for more effective resource allocation, targeted marketing, and better positioning against local competitors, ultimately driving growth in those specific areas.
1. Advanced Micro Devices Inc
2. Apple Inc
3. ASUSTek Computer Inc
4. EVGA Corp
5. Imagination Technologies Ltd
6. Intel Corp
7. NVIDIA Corp
8. Qualcomm Inc
9. Samsung Electronics Co Ltd
10. SAPPHIRE Technology Ltd
The Asia Pacific Graphics Processing Unit (GPU) Market is valued at US$ 18,677.13 Million in 2022, it is projected to reach US$ 1,91,827.52 Million by 2030.
As per our report Asia Pacific Graphics Processing Unit (GPU) Market, the market size is valued at US$ 18,677.13 Million in 2022, projecting it to reach US$ 1,91,827.52 Million by 2030. This translates to a CAGR of approximately 33.8% during the forecast period.
The Asia Pacific Graphics Processing Unit (GPU) Market report typically cover these key segments-
The historic period, base year, and forecast period can vary slightly depending on the specific market research report. However, for the Asia Pacific Graphics Processing Unit (GPU) Market report:
The Asia Pacific Graphics Processing Unit (GPU) Market is populated by several key players, each contributing to its growth and innovation. Some of the major players include:
The Asia Pacific Graphics Processing Unit (GPU) Market report is valuable for diverse stakeholders, including:
Essentially, anyone involved in or considering involvement in the Asia Pacific Graphics Processing Unit (GPU) Market value chain can benefit from the information contained in a comprehensive market report.
E 1803, Panchshil Towers, Vagholi, Haveli, Pune- 412207, Maharashtra, India
US:+16467917070
sales@businessmarketinsights.com


 Get Free Sample For Asia Pacific Graphics Processing Unit (GPU) Market
