2028년까지 아시아 태평양 EV 충전 케이블 시장 예측 – 유형(민간 및 공공), 전원 공급 장치 유형(교체 충전 및 직접 충전), 케이블 길이(2미터~5미터, 6미터~10미터)별 코로나19 영향 및 지역 분석 및 10미터 이상), 충전 수준(레벨 1, 레벨 2 및 레벨 3) 및 재킷 재질(전체 고무 재킷, 열가소성 엘라스토머(TPE) 재킷 및 폴리염화비닐(PVC) 재킷)

TIPRE00026648 | Pages: 125 | Electronics and Semiconductor | Jan 2022 | Type: Regional | Status: Published

시장 소개

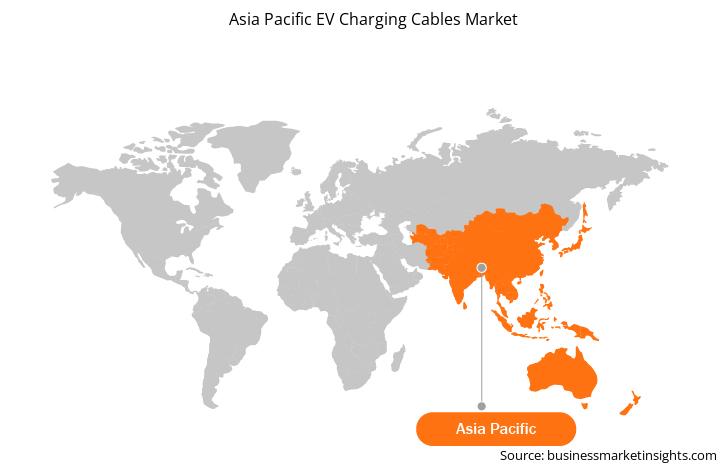
아시아 태평양은 세계에서 가장 빠르게 성장하는 선두 지역으로 부상했습니다. 중국, 인도, 일본의 광범위한 제조 시설로 인한 글로벌 자동차 제조 공간; 대규모 소비자 기반; 그리고 주요 시장 참가자의 존재. 중국은 아시아 태평양 지역에서 가장 큰 전기 자동차 시장으로, 충전소의 비중이 높습니다. 이 지역의 EV 충전 케이블 시장은 주로 전기 자동차 생산 증가와 기술 업그레이드에 의해 주도됩니다. 자동차 제조 회사의 혁신과 정부 기관의 투자로 아시아 태평양 지역의 자동차 생산이 증가하여 전기 자동차에 대한 수요가 증가했습니다. 장거리 트럭 운송을 용이하게 하기 위한 메가차저의 개발은 APAC EV 충전 케이블 시장의 성장을 이끄는 주요 요인입니다.

일본, 싱가포르 등 일부 선진국을 제외하고 아시아 태평양 지역 아직은 개발도상국으로 간주됩니다. 개발도상국에는 의료 인프라가 필요하지 않으며 이것이 2020년에 기록된 사례 수가 증가한 주된 이유였습니다. 경제 협력 개발 기구(OECD)에 따르면 전염병은 상당한 경제에 영향을 미쳤습니다. 인도, 호주, 일본 등이 어느 정도 그렇습니다. 의료 및 의료 시설이 부족하여 정부 당국은 생산 현장의 인력을 제한해야 했습니다. 2019년 내내 유럽보다 전기차 점유율이 높았던 중국에서는 2020년 상반기 판매량이 4.2% 안팎으로 소폭 감소했다. 근본적인 이유는 중국 내 전기차 구매 보험료 인하 때문일 수 있다. 중국에서와 마찬가지로 코로나19는 재생 에너지원, 배터리 에너지 저장 장치, 전기 자동차(EV), 재생 가능 냉난방을 포함한 녹색 에너지 부문에 부정적인 영향을 미쳤습니다. 더욱이 낮은 노동운동으로 인한 고객 수요 감소는 시장 성장에 영향을 미칠 것입니다. 심지어 Tesla의 상하이 Gigafactory에서는 미국, 영국, 호주의 공급 부족 가능성을 암시했습니다. 그리고 이러한 공급 제약은 에너지 저장 프로젝트와 함께 글로벌 EV 충전 케이블 시장에도 부정적인 영향을 미쳐 프로젝트 지연 또는 증가를 초래합니다. 비용.

시장 개요 및 역학

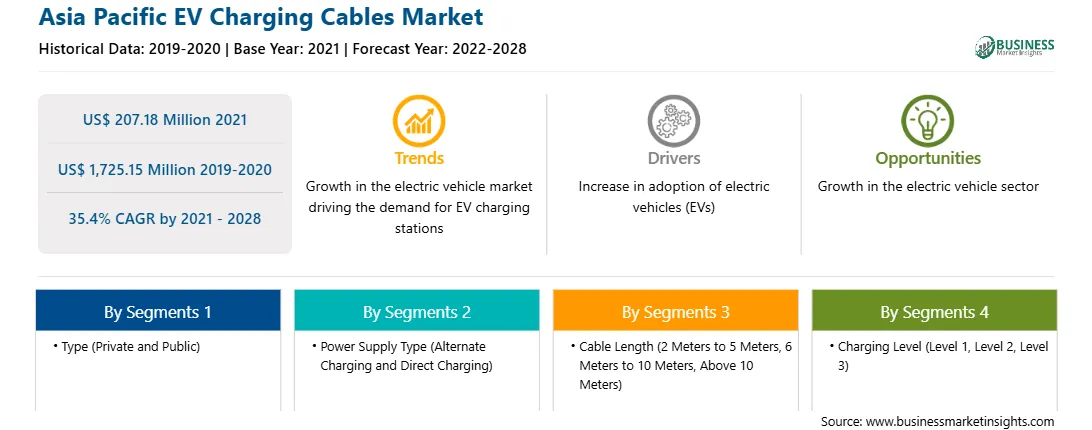
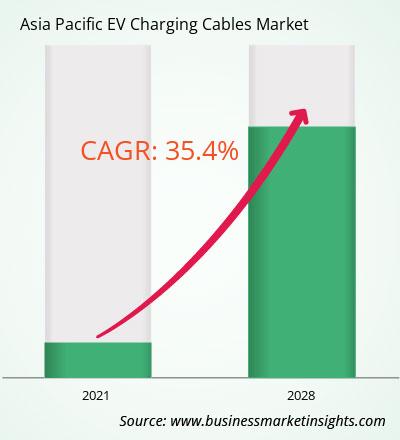
EV APAC의 충전 케이블 시장은 2021년 2억 718만 달러에서 2028년 17억 2515만 달러로 성장할 것으로 예상되며, 2021년부터 2028년까지 CAGR 35.4%로 성장할 것으로 예상됩니다. 트럭과 SUV의 인기와 소형 세단의 수요 증가 토요타, 현대, 닛산, 스바루, 기아의 판매량이 두 자릿수 증가 2020년에는 7,800만 대의 차량이 생산되었습니다. 전기 자동차(EV) 제조도 탄력을 받고 있으며, 전기 자동차만 제조하도록 제품 라인을 재구성하려는 OEM도 거의 없습니다. 볼보는 2021년 상반기에 2030년부터 전기차만 판매한다고 선언했습니다. 전 세계 많은 국가에서 자동차 배기가스 감축을 강조하는 목표를 설정했습니다. 그 일환으로 전기차와 관련 충전 인프라의 생산과 마케팅을 추진하기 시작했다. 따라서 전기 자동차에 대한 관심이 높아지면서 자동차 생산이 급증하면서 EV 충전 케이블 시장 성장이 가속화되고 있습니다.

주요 시장 부문

u>

APAC EV 충전 케이블 시장은 유형, 전원 공급 장치 유형, 케이블 길이, 충전 수준, 재킷 재료 및 국가를 기준으로 분류되었습니다. 유형에 따라 APAC EV 충전 케이블 시장은 개인 충전과 공공 충전으로 분류됩니다. 2020년에는 민간 부문이 시장을 지배했으며, 공공 부문은 예측 기간 동안 가장 빠르게 성장할 것으로 예상됩니다. 전원 공급 장치 유형에 따라 시장은 대체 충전과 직접 충전으로 분류됩니다. 대체 충전 부문은 2020년 시장을 지배했으며 직접 충전 부문은 예측 기간 동안 가장 빠르게 성장할 것으로 예상됩니다. 케이블 길이를 기준으로 시장은 2m~5m, 6m~10m, 10m 이상으로 분류됩니다. 2~5m 부문이 2020년 시장을 장악했으며, 6~10m 부문이 예측 기간 동안 가장 빠르게 성장할 것으로 예상됩니다. 충전 수준을 기준으로 EV 충전 케이블 시장은 레벨 1, 레벨 2, 레벨 3으로 분류됩니다. 2020년에는 레벨 2가 시장을 지배했으며 레벨 3 부문은 예측 기간 동안 가장 빠르게 성장할 것으로 예상됩니다. 재킷 소재 측면에서 EV 충전 케이블 시장은 전체 고무 재킷, 열가소성 엘라스토머 재킷, 폴리염화비닐 재킷으로 분류됩니다. 모든 고무 부문이 2020년 시장을 지배했으며 부문은 예측 기간 동안 가장 빠르게 성장할 것으로 예상됩니다.

주요 소스 및 회사 목록

APAC의 EV 충전 케이블 시장에 대한 이 보고서를 준비하는 데 참조되는 몇 가지 주요 1차 및 2차 소스로는 회사 웹사이트, 연례 보고서, 재무 보고서, 국가 정부 문서, 통계 데이터베이스 등이 있습니다. 보고서에 나열된 주요 회사는 Aptiv PLC입니다. 베센 국제 그룹; 코로플라스트 그룹; 디덴 코퍼레이션; EV 테이슨; 일반 케이블 기술 공사; 피닉스컨택트 E-모빌리티; (주)신본전자; 및 TE Connectivity Corporation 등이 있습니다.

구매 이유 보고서

  • APAC EV 충전 케이블 시장 환경을 이해하고 강력한 수익을 보장할 가능성이 가장 높은 시장 부문을 식별합니다.
  • APAC EV 충전 케이블 시장의 끊임없이 변화하는 경쟁 환경을 이해하여 경쟁에서 앞서 나가십시오.
  • 효율적인 M& 계획 ;가장 유망한 판매 가능성이 있는 시장 부문을 파악하여 APAC EV 충전 케이블 시장에서 파트너십 계약을 맺었습니다.
  • 시장 성과에 대한 통찰력 있고 포괄적인 분석을 통해 지식이 풍부한 비즈니스 결정을 내리는 데 도움이 됩니다. 다양한 세그먼트 형태 APAC EV 충전 케이블 시장
  • 2021~2028년 APAC 지역의 다양한 세그먼트별 시장 수익 예측을 확보하세요.

APAC EV 충전 케이블 시장 세분화

APAC EV 충전 케이블 시장 - 유형별

  • 공공
  • 비공개

APAC EV 충전 케이블 시장 - 전원 공급 장치별 유형

  • 대체 충전
  • 직접 충전

APAC EV 충전 케이블 시장 -케이블 길이별

  • < 스팬>2~5미터
  • 6~10미터
  • >10미터

APAC EV 충전 케이블 시장 - 충전 수준별

  • 병원
  • 외래 수술 센터
  • 클리닉

APAC EV 충전 케이블 시장 - 재킷 재질별

  • 레벨 1
  • 레벨 2
  • 레벨 3

APAC EV 충전 케이블 시장 - 국가별

  • 중국
  • 일본

    스팬>
  • 대한민국
  • 인도
  • 나머지 APAC

APAC EV 충전 케이블 시장 -회사 프로필

  • Aptiv PLC
  • BESEN INTERNATIONAL GROUP
  • 코로플라스트 그룹
  • DYDEN CORPORATION
  • EV TEISON
  • 일반 케이블 Technologies Corporation
  • Phoenix Contact E-Mobility
  • 신본전자(주)
  • TE Connectivity Corporation

1.           Introduction

1.1         Study Scope

1.2         The Insight Partners Research Report Guidance

1.3         Market Segmentation

2.           Key Takeaways

3.        Research Methodology

3.1         Coverage

3.2         Secondary Research

3.3         Primary Research

4.           APAC EV Charging Cables Market Landscape

4.1         Market Overview

4.2         APAC PEST Analysis

4.3         Ecosystem Analysis

4.4         Expert Opinion

5.           APAC EV Charging Cables Market- Key Market Dynamics

5.1         Market Drivers

5.1.1        Soaring EV Vehicle Production

5.1.2        Surge in EV Charging Facilities

5.2         Market Restraints

5.2.1        Higher Cost of Charging Stations

5.3         Market Opportunities

5.3.1        Development of Mega chargers to Facilitate Long-Distance Trucking

5.4         Future Trends

5.4.1        Advent of E-Mobility and Advanced Charging Technologies

5.5         Impact Analysis of Drivers and Restraints

6.           EV Charging Cables Market – APAC Analysis

6.1         EV Charging Cables Market Overview

6.2         EV Charging Cables Market –Revenue and Forecast to 2028 (US$ Million)

7.           APAC EV Charging Cables Market – By Type

7.1         Overview

7.2         EV Charging Cables Market, by Type (2020 and 2028)

7.3         Private Charging

7.3.1        Overview

7.3.2        Private Charging: EV Charging Cables Market – Revenue and Forecast to 2028 (US$ Million)

7.4         Public Charging

7.4.1        Overview

7.4.2        Public Charging: EV Charging Cables Market – Revenue and Forecast to 2028 (US$ Million)

8.           APAC EV Charging Cables Market – By Power Supply Type

8.1         Overview

8.2         EV Charging Cables Market, by Power Supply Type (2020 and 2028)

8.3         Alternate Charging

8.3.1        Overview

8.3.2        Alternate Charging: EV Charging Cables Market – Revenue and Forecast to 2028 (US$ Million)

8.4         Direct Charging

8.4.1        Overview

8.4.2        Direct Charging: EV Charging Cables Market – Revenue and Forecast to 2028 (US$ Million)

9.           APAC EV Charging Cables Market Analysis – By Cable Length

9.1         Overview

9.2         EV Charging Cables Market, By Cable Length (2020 and 2028)

9.3         2 Metres to 5 Metres

9.3.1        Overview

9.3.2        2 Metres to 5 Metres: EV Charging Cables Market – Revenue and Forecast to 2028 (US$ Million)

9.4         6 Metres to 10 Metres

9.4.1        Overview

9.4.2        6 Metres to 10 Metres: EV Charging Cables Market – Revenue and Forecast to 2028 (US$ Million)

9.5         Above 10 Metres

9.5.1        Overview

9.5.2        Above 10 Metres: EV Charging Cables Market – Revenue and Forecast to 2028 (US$ Million)

10.        APAC EV Charging Cables Market – By Charging Level

10.1      Overview

10.2      EV Charging Cables Market, by Charging Level (2020 and 2028)

10.3      Level 1

10.3.1     Overview

10.3.2     Level 1: EV Charging Cables Market – Revenue and Forecast to 2028 (US$ Million)

10.4      Level 2

10.4.1     Overview

10.4.2     Level 2: EV Charging Cables Market – Revenue and Forecast to 2028 (US$ Million)

10.5      Level 3

10.5.1     Overview

10.5.2     Level 3: EV Charging Cables Market – Revenue and Forecast to 2028 (US$ Million)

11.        APAC EV Charging Cables Market – By Jacket Material

11.1      Overview

11.2      EV Charging Cables Market, by Jacket Material (2020 and 2028)

11.3      All-Rubber Jacket

11.3.1     Overview

11.3.2     All-Rubber Jacket: EV Charging Cables Market – Revenue and Forecast to 2028 (US$ Million)

11.4      Thermoplastic Elastomer (TPE) Jacket

11.4.1     Overview

11.4.2     TPE Jacket: EV Charging Cables Market – Revenue and Forecast to 2028 (US$ Million)

11.5      Polyvinyl Chloride (PVC) Jacket

11.5.1     Overview

11.5.2     PVC Jacket: EV Charging Cables Market – Revenue and Forecast to 2028 (US$ Million)

12.        APAC EV Charging Cables Market – Country Analysis

12.1      Overview

12.1.1     Asia Pacific: EV Charging Cables Market, by Key Country

12.1.1.1       China: EV Charging Cables Market – Revenue and Forecast to 2028 (US$ Million)

12.1.1.1.1       China: EV Charging Cables Market, by Type

12.1.1.1.2       China: EV Charging Cables Market, by Power Supply Type

12.1.1.1.3       China: EV Charging Cables Market, by Cable Length

12.1.1.1.4       China: EV Charging Cables Market, by Charging Level

12.1.1.1.5       China: EV Charging Cables Market, by Jacket Material

12.1.1.2       India: EV Charging Cables Market – Revenue and Forecast to 2028 (US$ Million)

12.1.1.2.1       India: EV Charging Cables Market, by Type

12.1.1.2.2       India: EV Charging Cables Market, by Power Supply Type

12.1.1.2.3       India: EV Charging Cables Market, by Cable Length

12.1.1.2.4       India: EV Charging Cables Market, by Charging Level

12.1.1.2.5       India: EV Charging Cables Market, by Jacket Material

12.1.1.3       Japan: EV Charging Cables Market – Revenue and Forecast to 2028 (US$ Million)

12.1.1.3.1       Japan: EV Charging Cables Market, by Type

12.1.1.3.2       Japan: EV Charging Cables Market, by Power Supply Type

12.1.1.3.3       Japan: EV Charging Cables Market, by Cable Length

12.1.1.3.4       Japan: EV Charging Cables Market, by Charging Level

12.1.1.3.5       Japan: EV Charging Cables Market, by Jacket Material

12.1.1.4       South Korea: EV Charging Cables Market – Revenue and Forecast to 2028 (US$ Million)

12.1.1.4.1       South Korea: EV Charging Cables Market, by Type

12.1.1.4.2       South Korea: EV Charging Cables Market, by Power Supply Type

12.1.1.4.3       South Korea: EV Charging Cables Market, by Cable Length

12.1.1.4.4       South Korea: EV Charging Cables Market, by Charging Level

12.1.1.4.5       South Korea: EV Charging Cables Market, by Jacket Material

12.1.1.5       Rest of Asia Pacific: EV Charging Cables Market – Revenue and Forecast to 2028 (US$ Million)

12.1.1.5.1       Rest of Asia Pacific: EV Charging Cables Market, by Type

12.1.1.5.2       Rest of Asia Pacific: EV Charging Cables Market, by Power Supply Type

12.1.1.5.3       Rest of Asia Pacific: EV Charging Cables Market, by Cable Length

12.1.1.5.4       Rest of Asia Pacific: EV Charging Cables Market, by Charging Level

12.1.1.5.5       Rest of Asia Pacific: EV Charging Cables Market, by Jacket Material

13.        APAC EV Charging Cables Market- COVID-19 Impact Analysis

13.1      Overview

14.        Industry Landscape

14.1      Overview

14.2      Market Initiative

14.3      New Product Launch

14.4      Merger and Acquisition

15.        Company Profiles

15.1      Coroplast Group

15.1.1     Key Facts

15.1.2     Business Description

15.1.3     Products and Services

15.1.4     Financial Overview

15.1.5     SWOT Analysis

15.1.6     Key Developments

15.2      SINBON Electronics Co., Ltd.

15.2.1     Key Facts

15.2.2     Business Description

15.2.3     Products and Services

15.2.4     Financial Overview

15.2.5     SWOT Analysis

15.2.6     Key Developments

15.3      TE Connectivity Corporation

15.3.1     Key Facts

15.3.2     Business Description

15.3.3     Products and Services

15.3.4     Financial Overview

15.3.5     SWOT Analysis

15.3.6     Key Developments

15.4      Phoenix Contact E-Mobility

15.4.1     Key Facts

15.4.2     Business Description

15.4.3     Products and Services

15.4.4     Financial Overview

15.4.5     SWOT Analysis

15.4.6     Key Developments

15.5      BESEN INTERNATIONAL GROUP

15.5.1     Key Facts

15.5.2     Business Description

15.5.3     Products and Services

15.5.4     Financial Overview

15.5.5     SWOT Analysis

15.5.6     Key Developments

15.6      DYDEN CORPORATION

15.6.1     Key Facts

15.6.2     Business Description

15.6.3     Products and Services

15.6.4     Financial Overview

15.6.5     SWOT Analysis

15.6.6     Key Developments

15.7      EV TEISON

15.7.1     Key Facts

15.7.2     Business Description

15.7.3     Products and Services

15.7.4     Financial Overview

15.7.5     SWOT Analysis

15.7.6     Key Developments

15.8      General Cable Technologies Corporation

15.8.1     Key Facts

15.8.2     Business Description

15.8.3     Products and Services

15.8.4     Financial Overview

15.8.5     SWOT Analysis

15.8.6     Key Developments

15.9      Aptiv PLC

15.9.1     Key Facts

15.9.2     Business Description

15.9.3     Products and Services

15.9.4     Financial Overview

15.9.5     SWOT Analysis

15.9.6     Key Developments

16.        Appendix

16.1      About the Insight Partners

16.2      Word Index


LIST OF TABLES

Table 1.             APAC EV Charging Cables Market – Revenue, and Forecast to 2028 (US$ Million)

Table 2.             Asia Pacific: EV Charging Cables Market Revenue Share, by Key Country (2020 and 2028)

Table 3.             China: EV Charging Cables Market, by Type – Revenue and Forecast to 2028 (US$ Million)

Table 4.             China: EV Charging Cables Market, by Power Supply Type – Revenue and Forecast to 2028 (US$ Million)

Table 5.             China: EV Charging Cables Market, by Cable Length – Revenue and Forecast to 2028 (US$ Million)

Table 6.             China: EV Charging Cables Market, by Charging Level – Revenue and Forecast to 2028 (US$ Million)

Table 7.             China: EV Charging Cables Market, by Jacket Material – Revenue and Forecast to 2028 (US$ Million)

Table 8.             India: EV Charging Cables Market, by Type – Revenue and Forecast to 2028 (US$ Million)

Table 9.             India: EV Charging Cables Market, by Power Supply Type – Revenue and Forecast to 2028 (US$ Million)

Table 10.          India: EV Charging Cables Market, by Cable Length – Revenue and Forecast to 2028 (US$ Million)

Table 11.          India: EV Charging Cables Market, by Charging Level – Revenue and Forecast to 2028 (US$ Million)

Table 12.          India: EV Charging Cables Market, by Jacket Material – Revenue and Forecast to 2028 (US$ Million)

Table 13.          Japan: EV Charging Cables Market, by Type – Revenue and Forecast to 2028 (US$ Million)

Table 14.          Japan: EV Charging Cables Market, by Power Supply Type – Revenue and Forecast to 2028 (US$ Million)

Table 15.          Japan: EV Charging Cables Market, by Cable Length – Revenue and Forecast to 2028 (US$ Million)

Table 16.          Japan: EV Charging Cables Market, by Charging Level – Revenue and Forecast to 2028 (US$ Million)

Table 17.          Japan: EV Charging Cables Market, by Jacket Material – Revenue and Forecast to 2028 (US$ Million)

Table 18.          South Korea: EV Charging Cables Market, by Type – Revenue and Forecast to 2028 (US$ Million)

Table 19.          South Korea: EV Charging Cables Market, by Power Supply Type – Revenue and Forecast to 2028 (US$ Million)

Table 20.          South Korea: EV Charging Cables Market, by Cable Length – Revenue and Forecast to 2028 (US$ Million)

Table 21.          South Korea: EV Charging Cables Market, by Charging Level – Revenue and Forecast to 2028 (US$ Million)

Table 22.          South Korea: EV Charging Cables Market, by Jacket Material – Revenue and Forecast to 2028 (US$ Million)

Table 23.          Rest of Asia Pacific: EV Charging Cables Market, by Type – Revenue and Forecast to 2028 (US$ Million)

Table 24.          Rest of Asia Pacific: EV Charging Cables Market, by Power Supply Type – Revenue and Forecast to 2028 (US$ Million)

Table 25.          Rest of Asia Pacific: EV Charging Cables Market, by Cable Length – Revenue and Forecast to 2028 (US$ Million)

Table 26.          Rest of Asia Pacific: EV Charging Cables Market, by Charging Level – Revenue and Forecast to 2028 (US$ Million)

Table 27.          Rest of Asia Pacific: EV Charging Cables Market, by Jacket Material – Revenue and Forecast to 2028 (US$ Million)

Table 28.          List of Abbreviation


LIST OF FIGURES

Figure 1.           APAC EV Charging Cables Market Segmentation

Figure 2.           APAC EV Charging Cables Market Segmentation – By Country

Figure 3.           APAC EV Charging Cables Market Overview

Figure 4.           Private Charging Segment Held the Largest Market Share in 2020

Figure 5.           Alternate Charging Cables Held the Largest Market Share in 2020

Figure 6.           China to Show Significant Growth During Forecast Period

Figure 7.           APAC – PEST Analysis

Figure 8.           EV Charging Cables Market– Ecosystem Analysis

Figure 9.           Expert Opinion

Figure 10.        APAC EV Charging Cables Market Impact Analysis of Drivers and Restraints

Figure 11.        APAC EV Charging Cables Market – Revenue and Forecast to 2028 (US$ Million)

Figure 12.        APAC EV Charging Cables Market Revenue Share, by Type (2020 and 2028)

Figure 13.        APAC Private Charging: EV Charging Cables Market – Revenue and Forecast to 2028 (US$ Million)

Figure 14.        APAC Public Charging: EV Charging Cables Market – Revenue and Forecast to 2028 (US$ Million)

Figure 15.        APAC EV Charging Cables Market Revenue Share, by Power Supply Type (2020 and 2028)

Figure 16.        APAC Alternate Charging: EV Charging Cables Market – Revenue and Forecast to 2028 (US$ Million)

Figure 17.        APAC Direct Charging: EV Charging Cables Market – Revenue and Forecast to 2028 (US$ Million)

Figure 18.        APAC EV Charging Cables Market Revenue Share, by Cable Length (2020 and 2028)

Figure 19.        APAC 2 Metres to 5 Metres: EV Charging Cables Market – Revenue and Forecast to 2028 (US$ Million)

Figure 20.        APAC 6 Metres to 10 Metres: EV Charging Cables Market – Revenue and Forecast to 2028 (US$ Million)

Figure 21.        APAC Above 10 Metres: EV Charging Cables Market – Revenue and Forecast to 2028 (US$ Million)

Figure 22.        APAC EV Charging Cables Market Revenue Share, by Charging Level (2020 and 2028)

Figure 23.        APAC Level 1: EV Charging Cables Market – Revenue and Forecast to 2028 (US$ Million)

Figure 24.        APAC Level 2: EV Charging Cables Market – Revenue and Forecast to 2028 (US$ Million)

Figure 25.        APAC Level 3: EV Charging Cables Market – Revenue and Forecast to 2028 (US$ Million)

Figure 26.        APAC EV Charging Cables Market Revenue Share, by Jacket Material (2020 and 2028)

Figure 27.        APAC All-Rubber Jacket: EV Charging Cables Market – Revenue and Forecast to 2028 (US$ Million)

Figure 28.        APAC TPE Jacket: EV Charging Cables Market – Revenue and Forecast to 2028 (US$ Million)

Figure 29.        APAC PVC: EV Charging Cables Market – Revenue and Forecast to 2028 (US$ Million)

Figure 30.        Asia Pacific: EV Charging Cables Market, by Key Country-Revenue 2020 (US$ Million)

Figure 31.        Asia Pacific: EV Charging Cables Market Revenue Share, by Key Country (2020 and 2028)

Figure 32.        China: EV Charging Cables Market – Revenue and Forecast to 2028 (US$ Million)

Figure 33.        India: EV Charging Cables Market – Revenue and Forecast to 2028 (US$ Million)

Figure 34.        Japan: EV Charging Cables Market – Revenue and Forecast to 2028 (US$ Million)

Figure 35.        South Korea: EV Charging Cables Market – Revenue and Forecast to 2028 (US$ Million)

Figure 36.        Rest of Asia Pacific: EV Charging Cables Market – Revenue and Forecast to 2028 (US$ Million)

Figure 37.        Impact of COVID-19 Pandemic in APAC Country Markets

  1. Aptiv PLC
  2. BESEN INTERNATIONAL GROUP
  3. Coroplast Group
  4. DYDEN CORPORATION
  5. EV TEISON
  6. General Cable Technologies Corporation
  7. Phoenix Contact E-Mobility
  8. SINBON Electronics Co., Ltd.
  9. TE Connectivity Corporation
  • Save and reduce time carrying out entry-level research by identifying the growth, size, leading players and segments in the APAC EV Charging Cables market.
  • Highlights key business priorities in order to assist companies to realign their business strategies
  • The key findings and recommendations highlight crucial progressive industry trends in the APAC EV Charging Cables market, thereby allowing players across the value chain to develop effective long-term strategies
  • Develop/modify business expansion plans by using substantial growth offering developed and emerging markets
  • Scrutinize in-depth APAC market trends and outlook coupled with the factors driving the EV Charging Cables market, as well as those hindering it
  • Enhance the decision-making process by understanding the strategies that underpin commercial interest with respect to client products, segmentation, pricing and distribution
Report Code
Full Name
Country Name
Email Id
Phone Number
Job Title
Company
Requirement

Note : Your data will never be shared with third parties, however, we may send you information from time to time about our products that may be of interest to you. By submitting your details, you agree to be contacted by us. You may contact us at any time to opt-out.


Purchase Options
Single User License
$3000
$1800
Site License
$4000
$2400
Enterprise License
$5000
$3000