2028년까지 아시아 태평양 3D 매핑 및 모델링 시장 예측 – 코로나19 영향 및 지역 분석 – 배포 모드(클라우드 및 온프레미스), 조직 규모(중소기업 및 대기업), 구성 요소(소프트웨어 도구 및 서비스)별 , 3D 매핑 애플리케이션(검사 및 측정, 객체 재구성, 투영 및 탐색, 보고 및 가상화, 기타 3D 매핑 애플리케이션), 3D 모델링 애플리케이션(제품 마케팅, 애니메이션 및 영화, 게임 및 디자인, 건축 렌더링 및 기타 3D 모델링 애플리케이션) ) 및 업종(소매 및 소비재, 엔지니어링 및 건설, 의료 및 생명과학, 운송 및 물류, 정부 및 국방, 에너지 및 유틸리티, 미디어 및 엔터테인먼트, 제조 및 기타 업종)
분석 – 배포 모드(클라우드 및 온프레미스), 조직 규모(중소기업 및 대기업), 구성 요소(소프트웨어 도구 및 서비스)별 , 3D 매핑 애플리케이션(검사 및 측정, 객체 재구성, 투영 및 탐색, 보고 및 가상화, 기타 3D 매핑 애플리케이션), 3D 모델링 애플리케이션(제품 마케팅, 애니메이션 및 영화, 게임 및 디자인, 건축 렌더링 및 기타 3D 모델링 애플리케이션) ) 및 업종(소매 및 소비재, 엔지니어링 및 건설, 의료 및 생명과학, 운송 및 물류, 정부 및 국방, 에너지 및 유틸리티, 미디어 및 엔터테인먼트, 제조 및 기타 업종)
No. of Pages:
270
|
Report Code:
TIPRE00022189
|
Category:
Technology, Media and Telecommunications
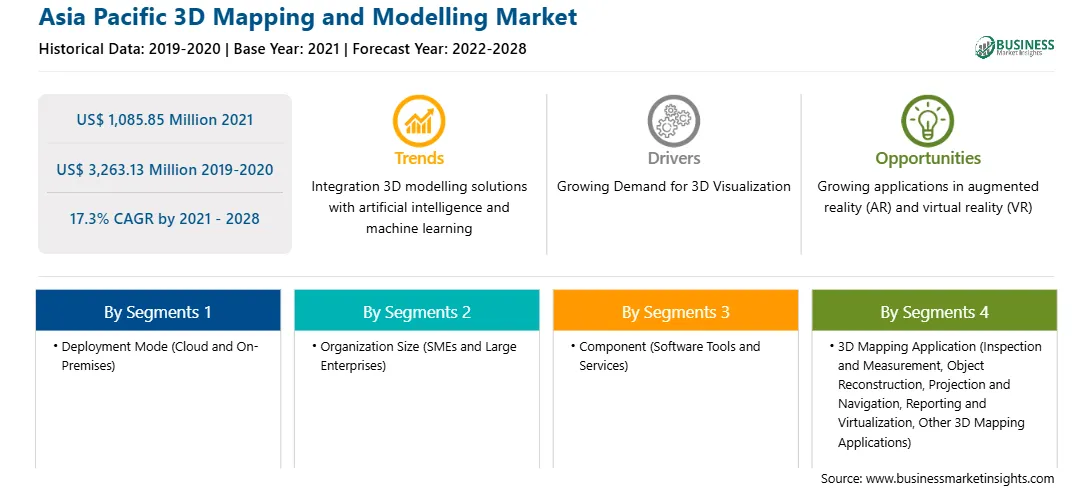
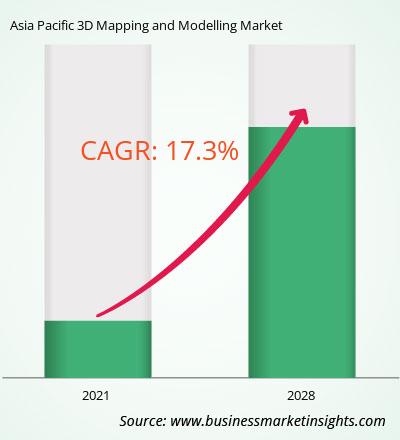
아시아 태평양 지역의 3D 매핑 및 모델링 시장은 2021년 미화 10억 8,585만 5,000만 달러에서 미화 3,263.13달러로 성장할 것으로 예상됩니다. 2028년까지 백만 달러; 2021년부터 2028년까지 CAGR 17.3%로 성장할 것으로 예상됩니다.
3D 매핑 및 모델링 도구는 다음과 같습니다. 애플리케이션 설계 및 엔지니어링을 위해 기업에서 사용됩니다. 이를 통해 디자이너와 엔지니어는 계획 및 설계 작업을 간소화하고 전반적인 사용자 경험을 향상시킬 수 있습니다. 현재 3D 매핑 및 모델링 시장은 대기업의 대규모 운영과 선진국에서 3D 매핑 및 모델링 솔루션의 높은 활용으로 인해 수익 공유 측면에서 대기업이 지배하고 있습니다. 예를 들어, 광범위한 기능과 간단한 프로세스를 갖춘 ZBrush는 3D 산업을 변화시킨 디지털 조각 및 페인팅 애플리케이션입니다. 이 회사는 디지털 아티스트에게 아름다운 인터페이스를 통해 가장 현대적인 도구를 제공합니다. 이는 유용성을 염두에 두고 제작된 다양한 도구를 통해 아티스트의 내면을 격려하는 동시에 놀랍도록 자연스러운 사용자 경험을 제공하며 사용자는 최대 10억 개의 다각형을 조각하여 상상할 수 있는 모든 것을 구성할 수 있습니다.
또한 대기업은 전반적인 운영 효율성을 개선하고 최종 사용자 경험을 향상시키기 위해 디지털 혁신 추세를 두드러지게 주도하고 있습니다. 그러나 중소기업과 기업 사이에서 디지털 솔루션과 클라우드 컴퓨팅의 활용이 증가하고 있습니다. 중견 기업은 예측 기간 동안 3D 매핑 및 모델링 시장에서 활동하는 시장 플레이어에게 매력적인 성장 기회를 제공할 것으로 예상됩니다. 또한 클라우드 기반 3D 매핑 및 모델링 솔루션의 채택과 인기가 높아짐에 따라 소규모 & 이제 중견 기업에서는 비용 이점과 손쉬운 통합을 위해 3D 매핑 및 모델링 솔루션에 대한 투자를 늘리고 있습니다. 따라서 이 요소는 향후 시장 성장을 위한 충분한 기회를 제공할 것입니다.
새로운 기능과 기술을 통해 공급업체는 새로운 고객을 유치할 수 있습니다. 고객을 확보하고 신흥 시장에서 입지를 확장합니다. 이 요인은 예측 기간 동안 상당한 CAGR로 아시아 태평양 3D 매핑 및 모델링 시장을 주도할 가능성이 높습니다.
아시아 태평양 3D 매핑 및 모델링 시장 수익 및 2028년 예측(미화 백만 달러)
아시아 태평양 3D 매핑 및 모델링 시장 세분화
아시아 태평양 3D 매핑 및 모델링 시장은 구성 요소, 3D 매핑 애플리케이션, 3D 모델링을 기준으로 분류됩니다. 애플리케이션, 배포 유형, 조직 규모, 업종 및 국가. 구성 요소를 기반으로 시장은 소프트웨어 도구와 서비스로 구분됩니다. 2021년에는 소프트웨어 도구 부문이 시장에서 더 큰 점유율을 차지했습니다. 그러나 및 서비스 부문은 예측 기간 동안 더 높은 CAGR을 기록할 것으로 예상됩니다. 3D 매핑 애플리케이션을 기반으로 하는 아시아 태평양 3D 매핑 및 모델링 시장은 검사 및 측정, 객체 재구성, 투영 및 탐색, 보고 및 가상화, 기타 3D 매핑 애플리케이션으로 분류됩니다. 2021년에는 프로젝션 및 내비게이션 부문이 가장 큰 시장 점유율을 차지했습니다. 보고 및 가상화 부문은 예측 기간 동안 시장에서 가장 높은 CAGR을 기록할 것으로 예상됩니다. 3D 매핑 애플리케이션을 기반으로 시장은 제품 마케팅, 애니메이션 및 영화, 게임 및 디자인, 건축 렌더링 및 기타 3D 모델링 애플리케이션으로 분류됩니다. 2021년에는 애니메이션과 영화 부문이 가장 큰 시장 점유율을 차지했습니다. 2021년에는 예측 기간 동안 시장에서 가장 높은 CAGR을 기록할 것으로 예상됩니다. 배포 유형에 따라 아시아 태평양 3D 매핑 및 모델링 시장은 클라우드와 온프레미스로 분기됩니다. 2021년에는 온프레미스 부문이 시장에서 더 큰 점유율을 차지했습니다. 반면 클라우드 부문은 예측 기간 동안 더 높은 CAGR을 기록할 것으로 예상됩니다. 조직 규모에 따라 시장은 중소기업과 대기업으로 구분됩니다. 2021년에는 대기업 부문이 시장에서 더 큰 점유율을 차지했습니다. 중소기업은 예측 기간 동안 더 높은 CAGR을 기록할 것으로 예상됩니다. 업종을 기준으로 시장은 소매 및 소비재, 엔지니어링 및 건설, 의료 및 생명과학, 운송 및 물류, 정부 및 국방, 에너지 및 유틸리티, 미디어 및 엔터테인먼트, 제조 및 기타 업종으로 분류됩니다. 2021년에는 엔지니어링 및 건설 부문이 가장 큰 시장 점유율을 차지했습니다. 그러나 미디어 및 엔터테인먼트 부문은 예측 기간 동안 시장에서 가장 높은 CAGR을 기록할 것으로 예상됩니다. 국가를 기준으로 시장은 중국, 일본, 인도, 호주, 한국 및 기타 APAC 지역으로 분류됩니다. 2021년에는 중국이 가장 큰 시장 점유율을 차지했습니다. 인도는 예측 기간 동안 가장 빠른 CAGR로 성장할 것으로 예상됩니다.
Pix4D SA; Pixologic, Inc.; 맥슨 컴퓨터 GmbH; 세계; GeoSLAM; 벤틀리시스템즈 통합; 알파벳 주식회사; 에스리; 오토데스크, Inc.; 에어버스; 트림블 주식회사; 사브 AB; 다쏘시스템; 어도비 벽돌; 미쓰비시전기(주); 탑콘 주식회사; 애플 주식회사; 인터맵 기술; 파운드리 Visionmongers Limited; 맵박스; 딥맵; 민간 지도; 및 Dynamic Map Platform Co., Ltd.는 아시아 태평양 3D 매핑 및 모델링 시장의 선두 기업 중 하나입니다.
Asia Pacific 3D Mapping and Modelling Strategic Insights
Strategic insights for Asia Pacific 3D Mapping and Modelling involve closely monitoring industry trends, consumer behaviours, and competitor actions to identify opportunities for growth. By leveraging data analytics, businesses can anticipate market shifts and make informed decisions that align with evolving customer needs. Understanding these dynamics helps companies adjust their strategies proactively, enhance customer engagement, and strengthen their competitive edge. Building strong relationships with stakeholders and staying agile in response to changes ensures long-term success in any market.
Get more information on this report
Asia Pacific 3D Mapping and Modelling Report Scope
Report Attribute
Details
Market size in 2021
US$ 1,085.85 Million
Market Size by 2028
US$ 3,263.13 Million
Global CAGR (2021 - 2028)
17.3%
Historical Data
2019-2020
Forecast period
2022-2028
Segments Covered
By 배포 모드
í´ë¼ì°ë ë° ì¨íë 미ì¤
By 조직 규모
ì¤ì기ì ë° ë기ì
By 구성 요소
ìíí¸ì¨ì´ ë구 ë° ìë¹ì¤
By 3D 매핑 애플리케이션
ê²ì¬ ë° ì¸¡ì
ê°ì²´ ì¬êµ¬ì±
í¬ì ë° íì
ë³´ê³ ë° ê°ìí
기í 3D 매í ì í리ì¼ì´ì
Regions and Countries Covered
아시아 태평양
중국
인도
일본
호주
기타 아시아 태평양 지역
Market leaders and key company profiles
Pix4D SA
Pixologic, Inc.
Maxon Computer GmbH
WRLD
GeoSLAM
Bentley Systems Incorporated
Alphabet Inc.
Esri
Autodesk, Inc.
Airbus
Get more information on this report
Asia Pacific 3D Mapping and Modelling Regional Insights
The regional scope of Asia Pacific 3D Mapping and Modelling refers to the geographical area in which a business operates and competes. Understanding regional nuances, such as local consumer preferences, economic conditions, and regulatory environments, is crucial for tailoring strategies to specific markets. Businesses can expand their reach by identifying underserved regions or adapting their offerings to meet regional demands. A clear regional focus allows for more effective resource allocation, targeted marketing, and better positioning against local competitors, ultimately driving growth in those specific areas.
Get more information on this report
Identical Market Reports with other Region/Countries
The List of Companies - Asia Pacific 3D Mapping and Modelling Market
Pix4D SA
Pixologic, Inc.
Maxon Computer GmbH
WRLD
GeoSLAM
Bentley Systems Incorporated
Alphabet Inc.
Esri
Autodesk, Inc.
Airbus
Trimble Inc.
Saab AB
Dassault Systèmes
Adobe
Mitsubishi Electric Corporation
Topcon Corporation
Apple Inc.
Mapbox
DeepMap
Civil Maps
Intermap Technologies
The Foundry Visionmongers Limited
Dynamic Map Platform Co., Ltd.
Frequently Asked Questions
How big is the Asia Pacific 3D Mapping and Modelling Market?
The Asia Pacific 3D Mapping and Modelling Market is valued at US$ 1,085.85 Million in 2021, it is projected to reach US$ 3,263.13 Million by 2028.
What is the CAGR for Asia Pacific 3D Mapping and Modelling Market by (2021 - 2028)?
As per our report Asia Pacific 3D Mapping and Modelling Market, the market size is valued at US$ 1,085.85 Million in 2021, projecting it to reach US$ 3,263.13 Million by 2028. This translates to a CAGR of approximately 17.3% during the forecast period.
What segments are covered in this report?
The Asia Pacific 3D Mapping and Modelling Market report typically cover these key segments-
배포 모드(클라우드 및 온프레미스)
조직 규모(중소기업 및 대기업)
구성 요소(소프트웨어 도구 및 서비스)
What is the historic period, base year, and forecast period taken for Asia Pacific 3D Mapping and Modelling Market?
The historic period, base year, and forecast period can vary slightly depending on the specific market research report. However, for the Asia Pacific 3D Mapping and Modelling Market report:
Historic Period : 2019-2020
Base Year : 2021
Forecast Period : 2022-2028
Who are the major players in Asia Pacific 3D Mapping and Modelling Market?
The Asia Pacific 3D Mapping and Modelling Market is populated by several key players, each contributing to its growth and innovation. Some of the major players include:
Pix4D SA
Pixologic, Inc.
Maxon Computer GmbH
WRLD
GeoSLAM
Bentley Systems Incorporated
Alphabet Inc.
Esri
Autodesk, Inc.
Airbus
Trimble Inc.
Saab AB
Dassault Systèmes
Adobe
Mitsubishi Electric Corporation
Topcon Corporation
Apple Inc.
Mapbox
DeepMap
Civil Maps
Intermap Technologies
The Foundry Visionmongers Limited
Dynamic Map Platform Co., Ltd.
Who should buy this report?
The Asia Pacific 3D Mapping and Modelling Market report is valuable for diverse stakeholders, including:
Investors: Provides insights for investment decisions pertaining to market growth, companies, or industry insights. Helps assess market attractiveness and potential returns.
Industry Players: Offers competitive intelligence, market sizing, and trend analysis to inform strategic planning, product development, and sales strategies.
Suppliers and Manufacturers: Helps understand market demand for components, materials, and services related to concerned industry.
Researchers and Consultants: Provides data and analysis for academic research, consulting projects, and market studies.
Financial Institutions: Helps assess risks and opportunities associated with financing or investing in the concerned market.
Essentially, anyone involved in or considering involvement in the Asia Pacific 3D Mapping and Modelling Market value chain can benefit from the information contained in a comprehensive market report.
Get Free Sample For Asia Pacific 3D Mapping and Modelling Market
1. Complete the form
2. Check your inbox (and spam/junk folder)
3. Your Personal Data is Secure with us
GDPR + CCPA Compliant
Personal & transactional information is kept safe from unauthorized use.
WHAT'S INCLUDED IN FULL REPORT : Market Dynamics,
Competitive Analysis and Assessment, Define Business Strategies, Market Outlook and
Trends, Market Size and Share Analysis, Growth Driving Factors, Future Commercial
Potential, Identify Regional Growth Engines


 Get Free Sample For Asia Pacific 3D Mapping and Modelling Market

