さらに、いくつかの企業が頑丈なタブレットのラインアップを拡大しています。2020年1月、Samsung Electronics Canadaは、Galaxy Tab Active Proがカナダで販売開始されたと発表しました。CESイベント組織によってイノベーション賞受賞者に選ばれた新しいGalaxy Tab Active Proは、現場、移動中、悪天候など、オフィス外の人々のために設計されています。このような状況は、北米の頑丈なタブレット市場の成長を後押ししています。
AAEON Technology Inc、Dell Technologies Inc、DT Research Inc、Panasonic Holdings Corp、Getac Holdings Corp、MilDef Group AB、NEXCOM International Co Ltd、Leonardo DRS Inc、Zebra Technologies Corp、Kontron AGは、北米の頑丈なタブレット市場で活動している大手企業の一部です。
North America Rugged Tablet Strategic Insights
Strategic insights for North America Rugged Tablet involve closely monitoring industry trends, consumer behaviours, and competitor actions to identify opportunities for growth. By leveraging data analytics, businesses can anticipate market shifts and make informed decisions that align with evolving customer needs. Understanding these dynamics helps companies adjust their strategies proactively, enhance customer engagement, and strengthen their competitive edge. Building strong relationships with stakeholders and staying agile in response to changes ensures long-term success in any market.
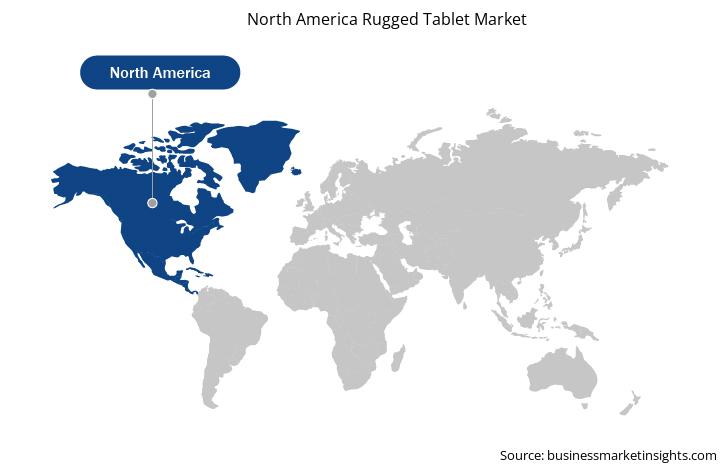
The regional scope of North America Rugged Tablet refers to the geographical area in which a business operates and competes. Understanding regional nuances, such as local consumer preferences, economic conditions, and regulatory environments, is crucial for tailoring strategies to specific markets. Businesses can expand their reach by identifying underserved regions or adapting their offerings to meet regional demands. A clear regional focus allows for more effective resource allocation, targeted marketing, and better positioning against local competitors, ultimately driving growth in those specific areas.
Get more information on this report
Identical Market Reports with other Region/Countries
The List of Companies - North America Rugged Tablet Market
1. AAEON Technology Inc
2. Dell Technologies Inc
3. DT Research Inc
4. Panasonic Holdings Corp
5. Getac Holdings Corp
6. MilDef Group AB
7. NEXCOM International Co Ltd
8. Leonardo DRS Inc
9. Zebra Technologies Corp
10. Kontron AG
Frequently Asked Questions
How big is the North America Rugged Tablet Market?
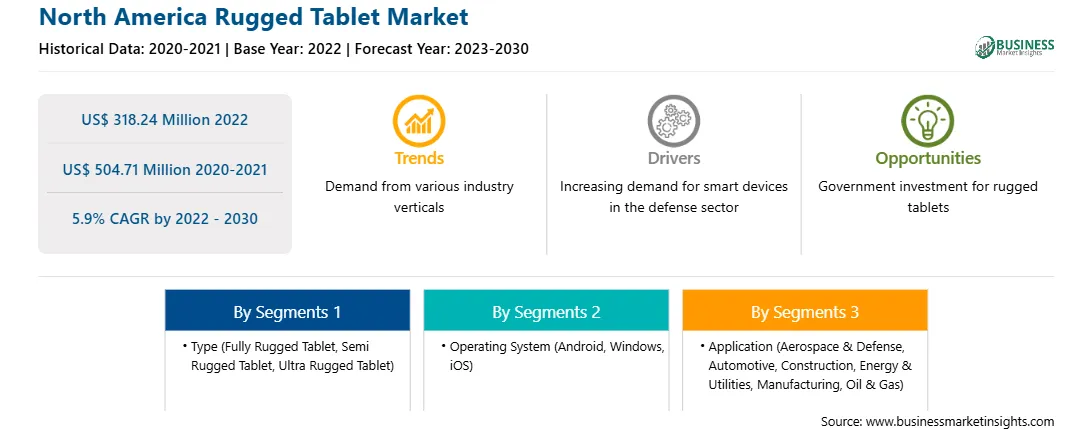
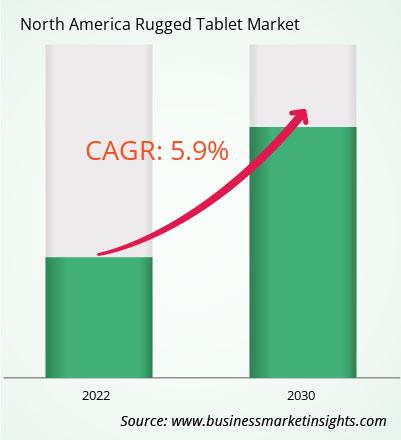
The North America Rugged Tablet Market is valued at US$ 318.24 Million in 2022, it is projected to reach US$ 504.71 Million by 2030.
What is the CAGR for North America Rugged Tablet Market by (2022 - 2030)?
As per our report North America Rugged Tablet Market, the market size is valued at US$ 318.24 Million in 2022, projecting it to reach US$ 504.71 Million by 2030. This translates to a CAGR of approximately 5.9% during the forecast period.
What segments are covered in this report?
The North America Rugged Tablet Market report typically cover these key segments-
What is the historic period, base year, and forecast period taken for North America Rugged Tablet Market?
The historic period, base year, and forecast period can vary slightly depending on the specific market research report. However, for the North America Rugged Tablet Market report:
Historic Period : 2020-2021
Base Year : 2022
Forecast Period : 2023-2030
Who are the major players in North America Rugged Tablet Market?
The North America Rugged Tablet Market is populated by several key players, each contributing to its growth and innovation. Some of the major players include:
AAEON Technology Inc
Dell Technologies Inc
DT Research Inc
Panasonic Holdings Corp
Getac Holdings Corp
MilDef Group AB
NEXCOM International Co Ltd
Leonardo DRS Inc
Zebra Technologies Corp
Kontron AG
Who should buy this report?
The North America Rugged Tablet Market report is valuable for diverse stakeholders, including:
Investors: Provides insights for investment decisions pertaining to market growth, companies, or industry insights. Helps assess market attractiveness and potential returns.
Industry Players: Offers competitive intelligence, market sizing, and trend analysis to inform strategic planning, product development, and sales strategies.
Suppliers and Manufacturers: Helps understand market demand for components, materials, and services related to concerned industry.
Researchers and Consultants: Provides data and analysis for academic research, consulting projects, and market studies.
Financial Institutions: Helps assess risks and opportunities associated with financing or investing in the concerned market.
Essentially, anyone involved in or considering involvement in the North America Rugged Tablet Market value chain can benefit from the information contained in a comprehensive market report.
Get Free Sample For North America Rugged Tablet Market
1. Complete the form
2. Check your inbox (and spam/junk folder)
3. Your Personal Data is Secure with us
GDPR + CCPA Compliant
Personal & transactional information is kept safe from unauthorized use.
WHAT'S INCLUDED IN FULL REPORT : Market Dynamics,
Competitive Analysis and Assessment, Define Business Strategies, Market Outlook and
Trends, Market Size and Share Analysis, Growth Driving Factors, Future Commercial
Potential, Identify Regional Growth Engines


 Get Free Sample For North America Rugged Tablet Market

