2030 年までのヨーロッパの収益保証市場予測 - 地域分析 - コンポーネント (ソリューションとサービス)、展開 (オンプレミスとクラウドベース)、組織規模 (中小企業と大企業)、業種 (BFSI、ホスピタリティ、通信、公益事業、その他) 別
No. of Pages: 100 | Report Code: BMIRE00030429 | Category: Technology, Media and Telecommunications
No. of Pages: 100 | Report Code: BMIRE00030429 | Category: Technology, Media and Telecommunications
Strategic insights for Europe Revenue Assurance involve closely monitoring industry trends, consumer behaviours, and competitor actions to identify opportunities for growth. By leveraging data analytics, businesses can anticipate market shifts and make informed decisions that align with evolving customer needs. Understanding these dynamics helps companies adjust their strategies proactively, enhance customer engagement, and strengthen their competitive edge. Building strong relationships with stakeholders and staying agile in response to changes ensures long-term success in any market.
| Report Attribute | Details |
|---|---|
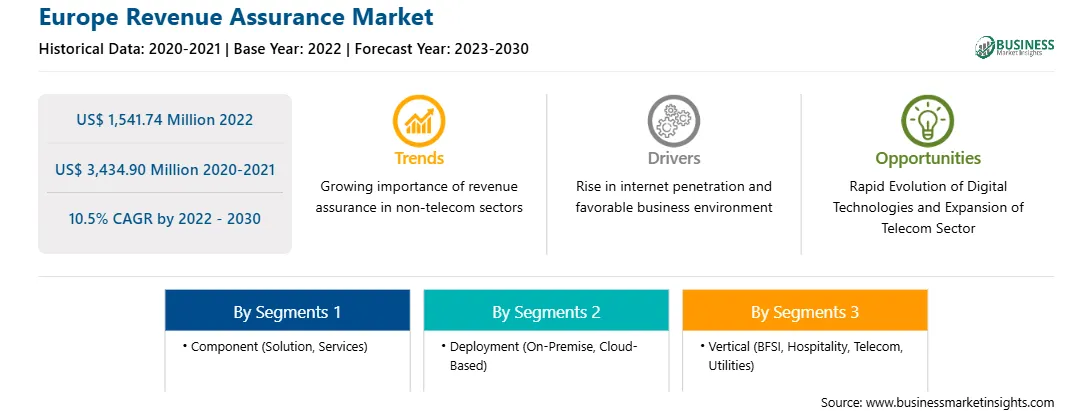
| Market size in 2022 | US$ 1,541.74 Million |
| Market Size by 2030 | US$ 3,434.90 Million |
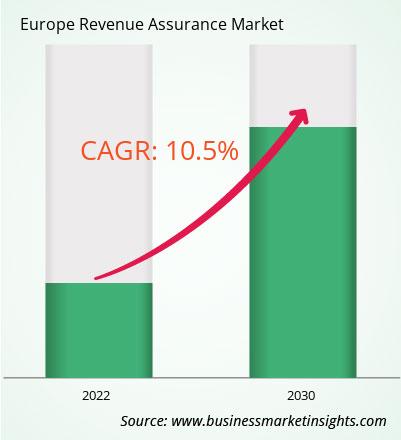
| Global CAGR (2022 - 2030) | 10.5% |
| Historical Data | 2020-2021 |
| Forecast period | 2023-2030 |
| Segments Covered |
By コンポーネント
|
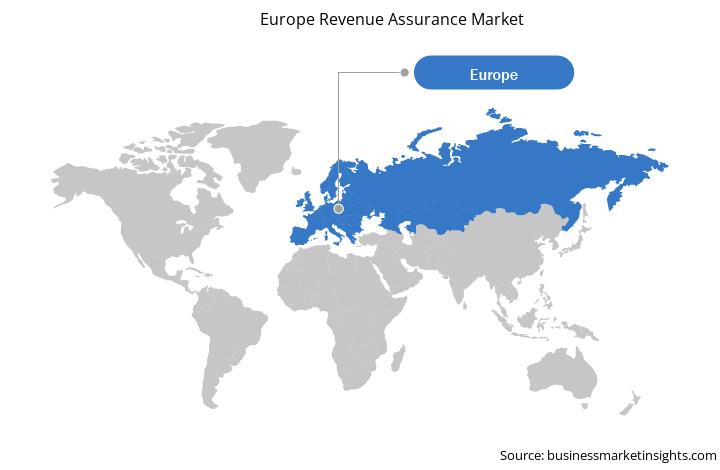
| Regions and Countries Covered | ヨーロッパ
|
| Market leaders and key company profiles |
The regional scope of Europe Revenue Assurance refers to the geographical area in which a business operates and competes. Understanding regional nuances, such as local consumer preferences, economic conditions, and regulatory environments, is crucial for tailoring strategies to specific markets. Businesses can expand their reach by identifying underserved regions or adapting their offerings to meet regional demands. A clear regional focus allows for more effective resource allocation, targeted marketing, and better positioning against local competitors, ultimately driving growth in those specific areas.
1. Cartesian Inc
2. Nokia Corp
3. Tata Consultancy Services Ltd
4. Amdocs
5. Subex Ltd
6. LATRO Services Inc
7. Araxxe SAS
8. Panamax Inc
9. Adapt IT Holdings Proprietary Ltd
The Europe Revenue Assurance Market is valued at US$ 1,541.74 Million in 2022, it is projected to reach US$ 3,434.90 Million by 2030.
As per our report Europe Revenue Assurance Market, the market size is valued at US$ 1,541.74 Million in 2022, projecting it to reach US$ 3,434.90 Million by 2030. This translates to a CAGR of approximately 10.5% during the forecast period.
The Europe Revenue Assurance Market report typically cover these key segments-
The historic period, base year, and forecast period can vary slightly depending on the specific market research report. However, for the Europe Revenue Assurance Market report:
The Europe Revenue Assurance Market is populated by several key players, each contributing to its growth and innovation. Some of the major players include:
The Europe Revenue Assurance Market report is valuable for diverse stakeholders, including:
Essentially, anyone involved in or considering involvement in the Europe Revenue Assurance Market value chain can benefit from the information contained in a comprehensive market report.
Office No. 1011, First floor, Farena Corporate Park, Magarpatta-Mundhwa road, Pune - 411028, Maharashtra, India
US:+16467917070
sales@businessmarketinsights.com


 Get Free Sample For Europe Revenue Assurance Market
