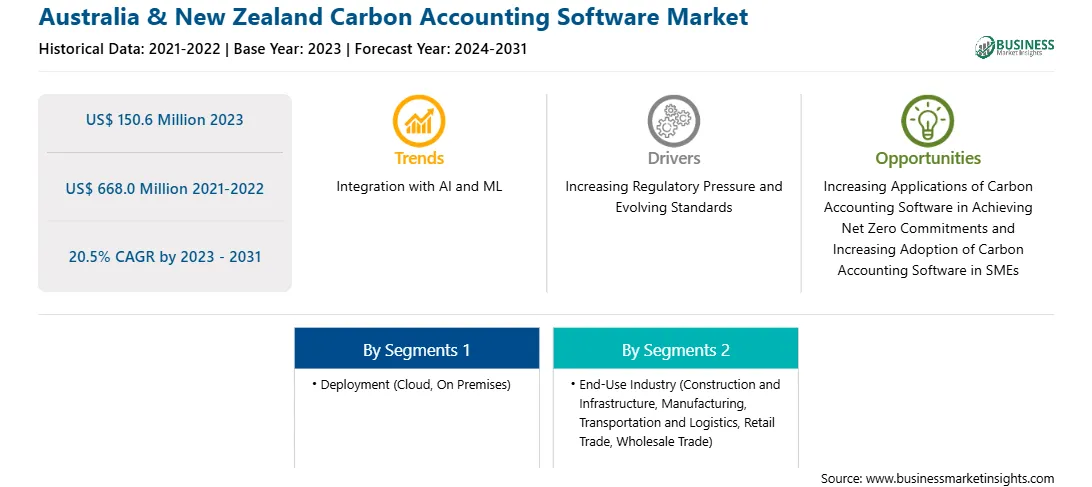
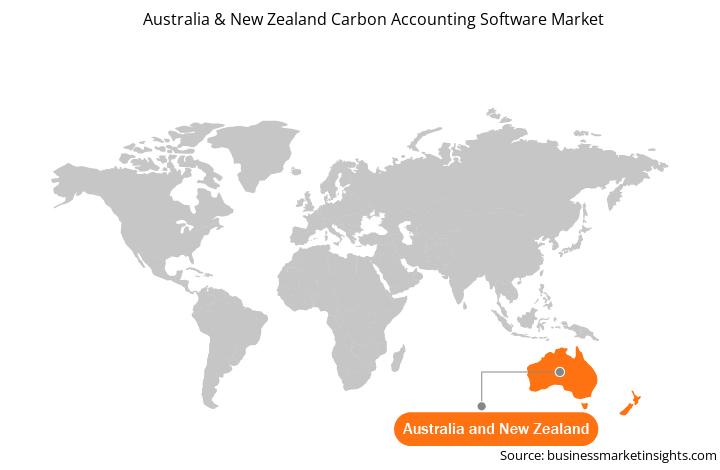
オーストラリアとニュージーランドの炭素会計ソフトウェア市場の規模と予測(2021年 - 2031年)、地域別シェア、傾向、成長機会分析レポートの対象範囲:展開(クラウドとオンプレミス)、最終用途産業(建設とインフラ、製造、輸送と物流、小売業、卸売業)、国別
オーストラリアとニュージーランドの炭素会計ソフトウェア市場は、オーストラリアとニュージーランドに分割されています。オーストラリアのさまざまなセクターからの二酸化炭素排出量は、2022年に3億5,590万トンを占めました。オーストラリアの可燃性燃料の使用は、世界の総二酸化炭素排出量の1%を占めています。国際エネルギー機関(IEA)によると、産業および輸送部門の二酸化炭素排出量は、オーストラリアの総二酸化炭素排出量の35%以上を占めています。さらに、製造業からの排出量は 2022 年に 5,334 万トンに達しました。対照的に、国内の運輸、郵便、倉庫部門は 2,850 万トンの炭素排出量を報告しました。
オーストラリアは、エネルギー部門の変革と輸送の脱炭素化により、ネットゼロ排出を達成するという野心的な目標を設定しました。州政府間で行動レベルに大きな違いがあるにもかかわらず、同国は連邦政策の欠点に対処するためのイニシアチブを取っています。現在の政策では、他のすべての国が同様の野心を追求した場合、二酸化炭素排出量は引き続き増加し、3°C を超える温暖化と一致すると予想されます。したがって、オーストラリア政府は、2030 年までにさらに野心的な炭素排出量削減目標を設定し、目標を達成するための政策を設定し、他の組織が持続可能性評価を改善できるように資金を提供する義務があると感じています。炭素会計ソフトウェアを使用すると、企業は環境について報告し、持続可能性目標を達成し、排出規制に準拠することが容易になります。
ニュージーランド環境省によると、2022年のニュージーランドの温室効果ガス排出量は二酸化炭素換算で7,112万トンでした。2022年の総排出量の85%以上を農業とエネルギー部門が占め、二酸化炭素は温室効果ガス総排出量の40%を占めました。輸送、石油精製、農業、エネルギーなどの部門からの二酸化炭素排出量は、2021年から2022年にかけて減少しました。パリ協定の一環として、ニュージーランドは2030年までに純排出量を2005年の総排出量の50%以下に削減するという目標を設定しました。また、国内の排出削減目標も設定しています。同国は、2024年12月31日までに公表される予定の第1回2年ごとの透明性報告書で、パリ協定に基づく目標に関する情報を開示する予定です。炭素排出量の削減のために、さまざまなセクターで事業を展開する企業が排出する炭素排出量を効率的に監視、追跡、分析、報告するための炭素会計ソフトウェアの必要性が高まっています。ニュージーランド政府は、炭素排出量削減の主なツールとして排出量取引制度(ETS)を使用しています。
オーストラリアとニュージーランドの炭素会計ソフトウェア市場は、導入に基づいてクラウドとオンプレミスに分かれています。炭素会計は、企業の温室効果ガス排出量を正確に測定、報告、削減するための第一歩です。従来の炭素排出量測定方法は手間がかかり、不正確であることが多かったのですが、炭素会計ソフトウェアなどの新しいツールやアプローチにより、企業は排出量を以前よりも迅速かつ正確に把握、報告、削減することができます。クラウドベースの炭素会計ソフトウェアは、その利点に対する認識の高まりと、日常業務から生成される膨大な量のデータの管理が容易なことから、あらゆる業界でますます採用されています。クラウドベースのソリューションは、インターネットへのアクセスによる大規模なストレージ容量の提供に加え、強力な処理能力を備えているため、炭素排出量データを迅速に追跡できます。さまざまな業界でクラウドベースのソリューションの需要が高まっているため、炭素会計ソフトウェアベンダーは、新しい高度なソリューションの開発にも注力しています。オーストラリアとニュージーランドでクラウドベースの炭素会計ソフトウェアを提供している主要企業には、Net0、IBM、Pangolin Associates、Avarni、NetNada、CarbonetiX、BDO などがあります。
Workiva、Avarni、Terrascope、Sumday、ClimateClever、CarbonetiX、GreenHalo、NedNada、Trace、Energy Solution Providers Limited、Opportune、IBM Corporation、SAP SE、Salesforce, Inc.、Microsoft、Diligent Corporation、Cogo、Carbon Trail は、この市場調査で紹介されているオーストラリアとニュージーランドの炭素会計ソフトウェア市場の主要企業です。
オーストラリアとニュージーランドの炭素会計ソフトウェア市場全体の規模は、一次情報源と二次情報源の両方を使用して算出されています。オーストラリアとニュージーランドの炭素会計ソフトウェア市場規模に関する定性的および定量的情報を取得するために、内部および外部の情報源を使用して徹底的な二次調査が実施されました。このプロセスは、すべての市場セグメントに関する市場の概要と予測を取得するのにも役立ちます。また、データを検証し、分析的洞察を得るために、業界関係者との複数の一次インタビューが実施されました。このプロセスには、VP、ビジネス開発マネージャー、市場情報マネージャー、全国販売マネージャーなどの業界の専門家と、オーストラリアとニュージーランドの炭素会計ソフトウェア市場を専門とする評価専門家、調査アナリスト、キーオピニオンリーダーなどの外部コンサルタントが含まれます。
1. Introduction
1.1 The Insight Partners Research Report Guidance
1.2 Market Segmentation
2. Executive Summary
2.1 Key Insights
3. Research Methodology
3.1 Secondary Research
3.2 Primary Research
3.2.1 Hypothesis formulation:
3.2.2 Macro-economic factor analysis:
3.2.3 Developing base number:
3.2.4 Data Triangulation:
3.2.5 Country level data:
4. Australia and New Zealand Carbon Accounting Software Market Landscape
4.1 Overview
4.2 PEST Analysis
4.3 Ecosystem Analysis
4.3.1 Software/Service Providers:
4.3.2 System Integrators:
4.3.3 End Users:
4.3.4 List of Vendors in the Value Chain
5. Australia and New Zealand Carbon Accounting Software Market – Key Market Dynamics
5.1 Australia and New Zealand Carbon Accounting Software Market – Key Market Dynamics
5.2 Market Drivers
5.2.1 Increasing Regulatory Pressure and Evolving Standards
5.2.2 Rising Focus on Controlling Scope 3 Greenhouse Gas Emissions
5.2.3 Gap Between Stakeholders' Expectations and Companies' Reporting Practices
5.3 Market Restraints
5.3.1 High Implementation Cost:
5.4 Market Opportunities
5.4.1 Increasing Applications of Carbon Accounting Software in Achieving Net Zero Commitments:
5.4.2 Increasing Adoption of Carbon Accounting Software in SMEs:
5.5 Future Trends
5.5.1 Integration with AI and ML:
5.6 Impact of Drivers and Restraints:
6. Australia and New Zealand Carbon Accounting Software Market Analysis
6.1 Australia and New Zealand Carbon Accounting Software Market Revenue (US$ Million), 2021–2031
6.2 Australia and New Zealand Carbon Accounting Software Market Forecast and Analysis
7. Australia and New Zealand Carbon Accounting Software Market Analysis – by Deployment
7.1 Cloud
7.1.1 Overview
7.1.2 Cloud: Australia and New Zealand Carbon Accounting Software Market – Revenue and Forecast to 2031 (US$ Million)
7.2 On Premises
7.2.1 Overview
7.2.2 On Premises: Australia and New Zealand Carbon Accounting Software Market – Revenue and Forecast to 2031 (US$ Million)
8. Australia and New Zealand Carbon Accounting Software Market Analysis – by End Use Industry
8.1 Construction and Infrastructure
8.1.1 Overview
8.1.2 Construction and Infrastructure: Australia and New Zealand Carbon Accounting Software Market – Revenue and Forecast to 2031 (US$ Million)
8.2 Manufacturing
8.2.1 Overview
8.2.2 Manufacturing: Australia and New Zealand Carbon Accounting Software Market – Revenue and Forecast to 2031 (US$ Million)
8.3 Transportation and Logistics
8.3.1 Overview
8.3.2 Transportation and Logistics: Australia and New Zealand Carbon Accounting Software Market – Revenue and Forecast to 2031 (US$ Million)
8.4 Retail Trade
8.4.1 Overview
8.4.2 Retail Trade: Australia and New Zealand Carbon Accounting Software Market – Revenue and Forecast to 2031 (US$ Million)
8.5 Wholesale Trade
8.5.1 Overview
8.5.2 Wholesale Trade: Australia and New Zealand Carbon Accounting Software Market – Revenue and Forecast to 2031 (US$ Million)
9. Australia and New Zealand Carbon Accounting Software Market – Country Analysis
9.1 Asia Pacific
9.1.1 Australia and New Zealand Carbon Accounting Software Market Revenue and Forecast and Analysis – by Country
9.1.1.1 Australia and New Zealand Carbon Accounting Software Market Revenue and Forecast and Analysis – by Country
9.1.1.2 Australia: Carbon Accounting Software Market – Revenue and Forecast to 2031 (US$ Million)
9.1.1.2.1 Australia: Carbon Accounting Software Market Breakdown by Deployment
9.1.1.2.2 Australia: Carbon Accounting Software Market Breakdown by End Use Industry
9.1.1.3 New Zealand: Carbon Accounting Software Market – Revenue and Forecast to 2031 (US$ Million)
9.1.1.3.1 New Zealand: Carbon Accounting Software Market Breakdown by Deployment
9.1.1.3.2 New Zealand: Carbon Accounting Software Market Breakdown by End Use Industry
10. Competitive Landscape
10.1 Heat Map Analysis by Key Players
10.2 Company Positioning & Concentration
11. Industry Landscape
11.1 Overview
11.2 Market Initiative
11.3 Product Development
11.4 Merger and Acquisition
12. Company Profiles
12.1 NetNada
12.1.1 Key Facts
12.1.2 Business Description
12.1.3 Products and Services
12.1.4 Financial Overview
12.1.5 SWOT Analysis
12.1.6 Key Developments
12.2 Trace
12.2.1 Key Facts
12.2.2 Business Description
12.2.3 Products and Services
12.2.4 Financial Overview
12.2.5 SWOT Analysis
12.2.6 Key Developments
12.3 Workiva, Inc.
12.3.1 Key Facts
12.3.2 Business Description
12.3.3 Products and Services
12.3.4 Financial Overview
12.3.5 SWOT Analysis
12.3.6 Key Developments
12.4 Avarni Pty Ltd
12.4.1 Key Facts
12.4.2 Business Description
12.4.3 Products and Services
12.4.4 Financial Overview
12.4.5 SWOT Analysis
12.4.6 Key Developments
12.5 Terrascope
12.5.1 Key Facts
12.5.2 Business Description
12.5.3 Products and Services
12.5.4 Financial Overview
12.5.5 SWOT Analysis
12.5.6 Key Developments
12.6 CarbonetiX
12.6.1 Key Facts
12.6.2 Business Description
12.6.3 Products and Services
12.6.4 Financial Overview
12.6.5 SWOT Analysis
12.6.6 Key Developments
12.7 GreenHalo
12.7.1 Key Facts
12.7.2 Business Description
12.7.3 Products and Services
12.7.4 Financial Overview
12.7.5 SWOT Analysis
12.7.6 Key Developments
12.8 Energy Solution Providers Limited
12.8.1 Key Facts
12.8.2 Business Description
12.8.3 Products and Services
12.8.4 Financial Overview
12.8.5 SWOT Analysis
12.8.6 Key Developments
12.9 Cogo
12.9.1 Key Facts
12.9.2 Business Description
12.9.3 Products and Services
12.9.4 Financial Overview
12.9.5 SWOT Analysis
12.9.6 Key Developments
12.10 CarbonTrail Limited
12.10.1 Key Facts
12.10.2 Business Description
12.10.3 Products and Services
12.10.4 Financial Overview
12.10.5 SWOT Analysis
12.10.6 Key Developments
12.11 Opportune
12.11.1 Key Facts
12.11.2 Business Description
12.11.3 Products and Services
12.11.4 Financial Overview
12.11.5 SWOT Analysis
12.11.6 Key Developments
12.12 Sumday
12.12.1 Key Facts
12.12.2 Business Description
12.12.3 Products and Services
12.12.4 Financial Overview
12.12.5 SWOT Analysis
12.12.6 Key Developments
12.13 ClimateClever PTY LTD
12.13.1 Key Facts
12.13.2 Business Description
12.13.3 Products and Services
12.13.4 Financial Overview
12.13.5 SWOT Analysis
12.13.6 Key Developments
12.14 International Business Machines Corp
12.14.1 Key Facts
12.14.2 Business Description
12.14.3 Products and Services
12.14.4 Financial Overview
12.14.5 SWOT Analysis
12.14.6 Key Developments
12.15 SAP SE
12.15.1 Key Facts
12.15.2 Business Description
12.15.3 Products and Services
12.15.4 Financial Overview
12.15.5 SWOT Analysis
12.15.6 Key Developments
12.16 Salesforce Inc
12.16.1 Key Facts
12.16.2 Business Description
12.16.3 Products and Services
12.16.4 Financial Overview
12.16.5 SWOT Analysis
12.16.6 Key Developments
12.17 Microsoft Corp
12.17.1 Key Facts
12.17.2 Business Description
12.17.3 Products and Services
12.17.4 Financial Overview
12.17.5 SWOT Analysis
12.17.6 Key Developments
12.18 Diligent Corporation.
12.18.1 Key Facts
12.18.2 Business Description
12.18.3 Products and Services
12.18.4 Financial Overview
12.18.5 SWOT Analysis
12.18.6 Key Developments
13. Appendix
13.1 Word Index
13.2 About The Insight Partners
List of Tables
Table 1. Australia and New Zealand Carbon Accounting Software Market Segmentation
Table 2. List of Vendors
Table 3. Australia and New Zealand Carbon Accounting Software Market – Revenue and Forecast to 2031 (US$ Million)
Table 4. Australia and New Zealand Carbon Accounting Software Market – Revenue and Forecast to 2031 (US$ Million) – by Deployment
Table 5. Australia and New Zealand Carbon Accounting Software Market – Revenue and Forecast to 2031 (US$ Million) – by End Use Industry
Table 6. Australia and New Zealand Carbon Accounting Software Market – Revenue and Forecast to 2031 (US$ Million) – by Country
Table 7. Australia: Carbon Accounting Software Market – Revenue and Forecast to 2031 (US$ Million) – by Deployment
Table 8. Australia: Carbon Accounting Software Market – Revenue and Forecast to 2031 (US$ Million) – by End Use Industry
Table 9. New Zealand: Carbon Accounting Software Market – Revenue and Forecast to 2031 (US$ Million) – by Deployment
Table 10. New Zealand: Carbon Accounting Software Market – Revenue and Forecast to 2031 (US$ Million) – by End Use Industry
Table 11. Company Positioning & Concentration
Table 12. List of Abbreviation
List of Figures
Figure 1. Australia and New Zealand Carbon Accounting Software Market Segmentation, by Country
Figure 2. PEST Analysis
Figure 3. Impact Analysis of Drivers and Restraints
Figure 4. Australia and New Zealand Carbon Accounting Software Market Revenue (US$ Million), 2021–2031
Figure 5. Australia and New Zealand Carbon Accounting Software Market Share (%) – by Deployment, 2023 and 2031
Figure 6. Cloud: Australia and New Zealand Carbon Accounting Software Market – Revenue and Forecast to 2031 (US$ Million)
Figure 7. On Premises: Australia and New Zealand Carbon Accounting Software Market – Revenue and Forecast to 2031 (US$ Million)
Figure 8. Australia and New Zealand Carbon Accounting Software Market Share (%) – by End Use Industry, 2023 and 2031
Figure 9. Construction and Infrastructure: Australia and New Zealand Carbon Accounting Software Market – Revenue and Forecast to 2031 (US$ Million)
Figure 10. Manufacturing: Australia and New Zealand Carbon Accounting Software Market – Revenue and Forecast to 2031 (US$ Million)
Figure 11. Transportation and Logistics: Australia and New Zealand Carbon Accounting Software Market – Revenue and Forecast to 2031 (US$ Million)
Figure 12. Retail Trade: Australia and New Zealand Carbon Accounting Software Market – Revenue and Forecast to 2031 (US$ Million)
Figure 13. Wholesale Trade: Australia and New Zealand Carbon Accounting Software Market – Revenue and Forecast to 2031 (US$ Million)
Figure 14. Australia and New Zealand Carbon Accounting Software Market Breakdown by Key Countries, 2023 and 2031 (%)
Figure 15. Australia: Carbon Accounting Software Market – Revenue and Forecast to 2031 (US$ Million)
Figure 16. New Zealand: Carbon Accounting Software Market – Revenue and Forecast to 2031 (US$ Million)
Figure 17. Heat Map Analysis by Key Players
- Workiva
- Avarni
- Terrascope
- Sumday
- ClimateClever
- CarbonetiX
- GreenHalo
- NedNada
- Trace
- Energy Solution Providers Limite
- Opportune
- IBM Corporation
- SAP SE
- Salesforce, Inc.
- Microsoft
- Diligent Corporation
- Cogo
- Carbon Trail
- Save and reduce time carrying out entry-level research by identifying the growth, size, leading players, and segments in the Australia and New Zealand carbon accounting software market
- Highlights key business priorities in order to assist companies to realign their business strategies
- The key findings and recommendations such as specific country and segmental insight highlights crucial progressive industry trends in the Australia and New Zealand carbon accounting software market, thereby allowing players across the value chain to develop effective long-term strategies
- Develop/modify business expansion plans by using substantial growth offering developed and emerging markets
- Scrutinize in-depth market trends and outlook coupled with the factors driving the market, as well as those hindering it
- Enhance the decision-making process by understanding the strategies that underpin commercial interest with respect to client products, segmentation, pricing, and distribution