アジア太平洋地域のウォームギア駆動市場予測 2030年 - 地域分析 - 動作タイプ(円筒ウォームギア、シングルおよびダブルエンベロープウォームギア)、製品タイプ(ハウジングユニット、ギアセット、高速ウォーム)、材料タイプ(ステンレス鋼、鋳鉄、アルミニウム、その他)別

BMIRE00030391 | Pages: 80 | Manufacturing and Construction | Jul 2024 | Type: Regional | Status: Published

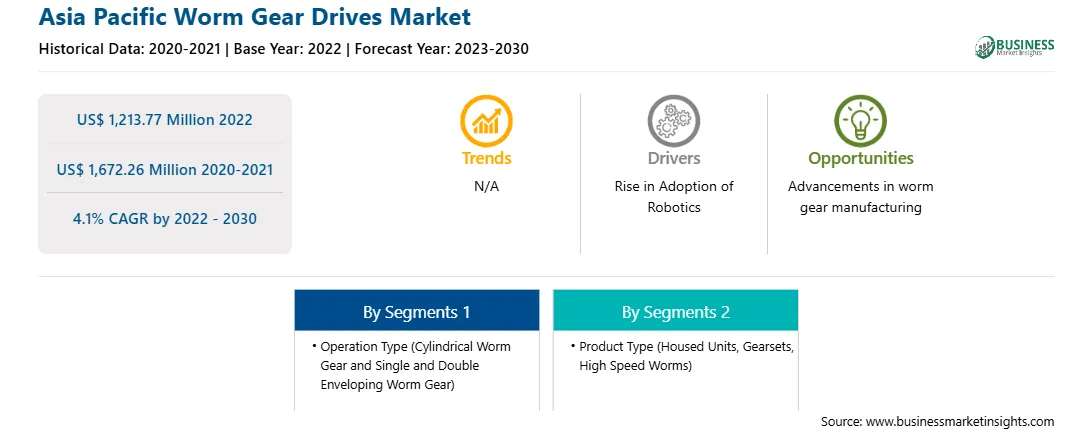
アジア太平洋地域のウォームギアドライブ市場は、2022年に12億1,377万米ドルと評価され、2030年までに16億7,226万米ドルに達すると予想されています。また、2022年から2030年にかけて4.1%のCAGRを記録すると予測されています。

ロボットの採用増加により、アジア太平洋地域のウォームギアドライブ市場が拡大

ロボットは、ウォームギアドライブベンダーの成長に大きな可能性を秘めた分野の1つです。ロボットが産業現場で目立つようになるにつれて、高性能ギアシステムの需要も今後数年間上昇傾向を続けると予想されます。ウォームギアドライブは正確な動作制御を可能にし、ロボットデバイスの正確な位置決めと制御された動きを促進します。ウォームスレッドとウォームホイールの歯の組み合わせにより、微調整とスムーズな操作が可能になり、正確で再現可能な動きが実現します。ウォームギアドライブは、単一ステージで大きなギア減速比を提供するため、低速および高トルク出力を必要とするアプリケーションに最適です。これにより、産業用マテリアルハンドリングおよび組み立てプロセスのロボットは、正確な制御と大きな重量処理能力でジョブを実行できます。世界中のメーカーによる産業用ロボットの採用への投資の増加は、ウォームギアドライブ市場の成長にとって有利な機会を生み出す可能性があります。 2023年10月、ボルボはファナックと産業用ロボットの導入に関する契約を締結しました。契約条件に基づき、ファナックはボルボのグローバル製造施設に産業用ロボットを供給する。第1フェーズでは、ファナックはスロバキアのコシツェにあるボルボの計画中の電気自動車(EV)製造施設、およびベルギーのゲントと中国の大慶の拠点に700台以上のロボットを供給する予定です。この発表は、2030年までに電気自動車のみを生産し、2040年までにカーボンニュートラルになることを含む、ボルボのより大規模なグリーン計画の一環です。この目標は、ファナックの産業用ロボットなどの自動化技術の活用を重視しており、スロバキアの工場はボルボ初のカーボンニュートラル生産拠点となる予定です。産業用ロボットの導入に対するメーカーの投資に加えて、インダストリー4.0の盛んなトレンドは、自動化技術とロボットの採用を推進するもう1つの要因であり、ウォームギアドライブ業界にさらなる利益をもたらすことが期待されています。

アジア太平洋ウォームギアドライブ市場の概要

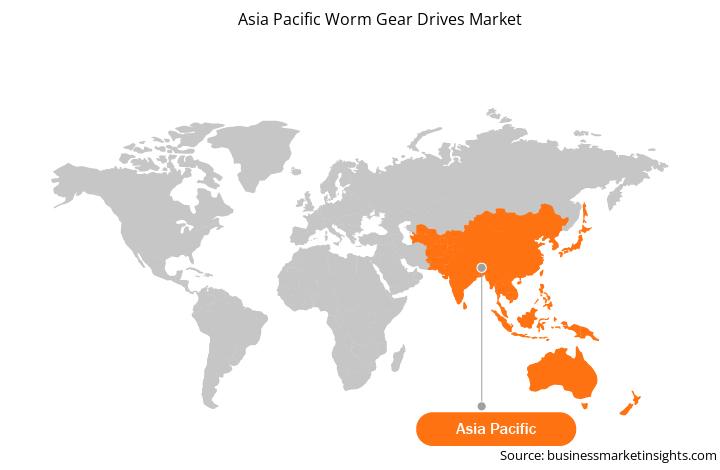
インド、中国、オーストラリアは、アジア太平洋(APAC)のウォームギアドライブ市場への主要な貢献国です。この地域の技術進歩への取り組みと、製造業および自動車部門への投資の増加により、ウォームギアドライブ市場は持続可能な成長を遂げる可能性があります。アジア太平洋地域が世界の主要な製造業の場として発展を続ける中、ウォームギアドライブなどの効率的で信頼性の高い動力伝達システムの需要は今後数年間で急増すると見込まれています。

インドでは、自動車部門の堅調な業績と政府による国内製造業への重点が、この市場の成長を促す環境を作り出しています。自動車産業は、同国の製造業 GDP のかなりの部分を占めています。さらに、生産連動インセンティブ (PLI) 制度やその他の政府制度は、製造部門をさらに刺激し、高度な動力伝達システムの採用の増加につながる可能性があります。

世界的に有名な製造大国である中国は、アジア太平洋地域の産業環境を形成する上で極めて重要な役割を果たしています。技術の進歩と自立に焦点を当てた野心的な「Made in China 2025」イニシアチブは、ウォームギアドライブ市場に大きく貢献しています。中国政府からの多額の財政支援と国内のイノベーションへの重点により、ウォームギアドライブ市場のサプライヤーは、中国の先進製造業の進化するニーズに応える機会が生まれています。

オーストラリアは、強力な自動車および製造業を擁しており、アジア太平洋地域のウォームギアドライブ市場の成長に大きく貢献しています。同国の自動車部品業界は大幅な売上高を達成しており、政府の現代製造戦略(MMS)スキームなどのイニシアチブにより、国内製造が促進されています。オーストラリアにおける世界的なOEMのローカリゼーションの取り組みも、自動車サプライチェーン内のウォームギアドライブなどの精密部品の需要を高めています。

アジア太平洋地域のウォームギアドライブ市場の収益と2030年までの予測(百万米ドル)

アジア太平洋地域のウォームギアドライブ市場のセグメンテーション

アジア太平洋地域のウォームギアドライブ市場は、操作タイプ、製品タイプ、材料タイプ、および国に分類されています。

操作タイプに基づいて、アジア太平洋地域のウォームギアドライブ市場は、円筒ウォームギアとシングルおよびダブルエンベロープウォームギアに分かれています。円筒ウォームギアセグメントは、2022年に大きな市場シェアを占めました。

製品タイプでは、アジア太平洋地域のウォームギアドライブ市場は、ハウジングユニット、ギアセット、高速ウォームに分類されます。ギアセットセグメントは、2022年に最大の市場シェアを占めました。

材料タイプ別に見ると、アジア太平洋地域のウォームギアドライブ市場は、ステンレス鋼、鋳鉄、アルミニウム、その他に分類されています。ステンレス鋼セグメントは、2022年に最大の市場シェアを占めました。

国別に見ると、アジア太平洋地域のウォームギアドライブ市場は、オーストラリア、中国、インド、日本、韓国、その他のアジア太平洋地域に分かれています。 2022年、アジア太平洋地域のウォームギアドライブ市場シェアは中国が独占しました。

Kohara Gear Industry Co Ltd、Tulsa Winch Inc、Nozag AG、The Timken Co、Tracey Gear Incは、アジア太平洋地域のウォームギアドライブ市場で事業を展開している大手企業の一部です。

TABLE OF CONTENTS


1. Introduction

1.1 The Insight Partners Research Report Guidance

1.2 Market Segmentation

2. Executive Summary

2.1 Key Insights

2.2 Market Attractiveness

3. Research Methodology

3.1 Coverage

3.2 Secondary Research

3.3 Primary Research

4. Asia Pacific Worm Gear Drives Market Landscape

4.1 Overview

4.2 PEST Analysis

4.3 Ecosystem Analysis

5. Asia Pacific Worm Gear Drives Market - Key Market Dynamics

5.1 Market Drivers

5.1.1 Increased Automotive Sales Globally

5.1.2 Growing Elevator and Escalator Installations Due to Increasing Construction Activities

5.2 Market Restraints

5.2.1 Presence of Alternative Products

5.3 Market Opportunities

5.3.1 Rise in Adoption of Robotics

5.4 Future Trends

5.4.1 Advancements in Worm Gear Manufacturing

5.5 Impact of Drivers and Restraints:

6. Worm Gear Drives Market - Asia Pacific Market Analysis

6.1 Worm Gear Drives Market Revenue (US$ Million), 2020-2030

6.2 Worm Gear Drives Market Forecast Analysis

7. Asia Pacific Worm Gear Drives Market Analysis - by Operation Type

7.1 Cylindrical Worm Gear

7.1.1 Overview

7.1.2 Cylindrical Worm Gear: Worm Gear Drives Market - Revenue and Forecast to 2030 (US$ Million)

7.2 Single and Double Enveloping Worm Gear

7.2.1 Overview

7.2.2 Single and Double Enveloping Worm Gear: Worm Gear Drives Market - Revenue and Forecast to 2030 (US$ Million)

8. Asia Pacific Worm Gear Drives Market Analysis - by Product Type

8.1 Housed Units

8.1.1 Overview

8.1.2 Housed Units: Worm Gear Drives Market - Revenue and Forecast to 2030 (US$ Million)

8.2 Gearsets

8.2.1 Overview

8.2.2 Gearsets: Worm Gear Drives Market - Revenue and Forecast to 2030 (US$ Million)

8.3 High Speed Worms

8.3.1 Overview

8.3.2 High Speed Worms: Worm Gear Drives Market - Revenue and Forecast to 2030 (US$ Million)

9. Asia Pacific Worm Gear Drives Market Analysis - by Material Type

9.1 Stainless Steel

9.1.1 Overview

9.1.2 Stainless Steel: Worm Gear Drives Market - Revenue and Forecast to 2030 (US$ Million)

9.2 Cast Iron

9.2.1 Overview

9.2.2 Cast Iron: Worm Gear Drives Market - Revenue and Forecast to 2030 (US$ Million)

9.3 Aluminum

9.3.1 Overview

9.3.2 Aluminum: Worm Gear Drives Market - Revenue and Forecast to 2030 (US$ Million)

9.4 Others

9.4.1 Overview

9.4.2 Others: Worm Gear Drives Market - Revenue and Forecast to 2030 (US$ Million)

10. Asia Pacific Worm Gear Drives Market - Country Analysis

10.1 Asia Pacific Market Overview

10.1.1 Asia Pacific: Worm Gear Drives Market - Revenue and Forecast Analysis - by Country

10.1.1.1 Asia Pacific: Worm Gear Drives Market - Revenue and Forecast Analysis - by Country

10.1.1.2 Australia: Worm Gear Drives Market - Revenue and Forecast to 2030 (US$ Million)

10.1.1.2.1 Australia: Worm Gear Drives Market Breakdown, by Operation Type

10.1.1.2.2 Australia: Worm Gear Drives Market Breakdown, by Product Type

10.1.1.2.3 Australia: Worm Gear Drives Market Breakdown, by Material Type

10.1.1.3 China: Worm Gear Drives Market - Revenue and Forecast to 2030 (US$ Million)

10.1.1.3.1 China: Worm Gear Drives Market Breakdown, by Operation Type

10.1.1.3.2 China: Worm Gear Drives Market Breakdown, by Product Type

10.1.1.3.3 China: Worm Gear Drives Market Breakdown, by Material Type

10.1.1.4 India: Worm Gear Drives Market - Revenue and Forecast to 2030 (US$ Million)

10.1.1.4.1 India: Worm Gear Drives Market Breakdown, by Operation Type

10.1.1.4.2 India: Worm Gear Drives Market Breakdown, by Product Type

10.1.1.4.3 India: Worm Gear Drives Market Breakdown, by Material Type

10.1.1.5 Japan: Worm Gear Drives Market - Revenue and Forecast to 2030 (US$ Million)

10.1.1.5.1 Japan: Worm Gear Drives Market Breakdown, by Operation Type

10.1.1.5.2 Japan: Worm Gear Drives Market Breakdown, by Product Type

10.1.1.5.3 Japan: Worm Gear Drives Market Breakdown, by Material Type

10.1.1.6 South Korea: Worm Gear Drives Market - Revenue and Forecast to 2030 (US$ Million)

10.1.1.6.1 South Korea: Worm Gear Drives Market Breakdown, by Operation Type

10.1.1.6.2 South Korea: Worm Gear Drives Market Breakdown, by Product Type

10.1.1.6.3 South Korea: Worm Gear Drives Market Breakdown, by Material Type

10.1.1.7 Rest of Asia Pacific: Worm Gear Drives Market - Revenue and Forecast to 2030 (US$ Million)

10.1.1.7.1 Rest of Asia Pacific: Worm Gear Drives Market Breakdown, by Operation Type

10.1.1.7.2 Rest of Asia Pacific: Worm Gear Drives Market Breakdown, by Product Type

10.1.1.7.3 Rest of Asia Pacific: Worm Gear Drives Market Breakdown, by Material Type

11. Competitive Landscape

11.1 Heat Map Analysis

11.2 Company Positioning & Concentration

12. Industry Landscape

12.1 Overview

12.2 Market Initiative

12.3 Product Development

13. Company Profiles

13.1 Kohara Gear Industry Co Ltd

13.1.1 Key Facts

13.1.2 Business Description

13.1.3 Products and Services

13.1.4 Financial Overview

13.1.5 SWOT Analysis

13.1.6 Key Developments

13.2 Tulsa Winch Inc

13.2.1 Key Facts

13.2.2 Business Description

13.2.3 Products and Services

13.2.4 Financial Overview

13.2.5 SWOT Analysis

13.2.6 Key Developments

13.3 Nozag AG

13.3.1 Key Facts

13.3.2 Business Description

13.3.3 Products and Services

13.3.4 Financial Overview

13.3.5 SWOT Analysis

13.3.6 Key Developments

13.4 The Timken Co

13.4.1 Key Facts

13.4.2 Business Description

13.4.3 Products and Services

13.4.4 Financial Overview

13.4.5 SWOT Analysis

13.4.6 Key Developments

13.5 Tracey Gear Inc

13.5.1 Key Facts

13.5.2 Business Description

13.5.3 Products and Services

13.5.4 Financial Overview

13.5.5 SWOT Analysis

13.5.6 Key Developments

14. Appendix

14.1 About The Insight Partners

List of Tables

Table 1. Worm Gear Drives Market Segmentation

Table 2. Worm Gear Drives Market - Revenue and Forecast to 2030 (US$ Million)

Table 3. Worm Gear Drives Market - Revenue and Forecast to 2030 (US$ Million) - by Operation Type

Table 4. Worm Gear Drives Market - Revenue and Forecast to 2030 (US$ Million) - by Product Type

Table 5. Worm Gear Drives Market - Revenue and Forecast to 2030 (US$ Million) - by Material Type

Table 6. Asia Pacific: Worm Gear Drives Market - Revenue and Forecast to 2030(US$ Million) - by Country

Table 7. Australia: Worm Gear Drives Market - Revenue and Forecast to 2030(US$ Million) - by Operation Type

Table 8. Australia: Worm Gear Drives Market - Revenue and Forecast to 2030(US$ Million) - by Product Type

Table 9. Australia: Worm Gear Drives Market - Revenue and Forecast to 2030(US$ Million) - by Material Type

Table 10. China: Worm Gear Drives Market - Revenue and Forecast to 2030(US$ Million) - by Operation Type

Table 11. China: Worm Gear Drives Market - Revenue and Forecast to 2030(US$ Million) - by Product Type

Table 12. China: Worm Gear Drives Market - Revenue and Forecast to 2030(US$ Million) - by Material Type

Table 13. India: Worm Gear Drives Market - Revenue and Forecast to 2030(US$ Million) - by Operation Type

Table 14. India: Worm Gear Drives Market - Revenue and Forecast to 2030(US$ Million) - by Product Type

Table 15. India: Worm Gear Drives Market - Revenue and Forecast to 2030(US$ Million) - by Material Type

Table 16. Japan: Worm Gear Drives Market - Revenue and Forecast to 2030(US$ Million) - by Operation Type

Table 17. Japan: Worm Gear Drives Market - Revenue and Forecast to 2030(US$ Million) - by Product Type

Table 18. Japan: Worm Gear Drives Market - Revenue and Forecast to 2030(US$ Million) - by Material Type

Table 19. South Korea: Worm Gear Drives Market - Revenue and Forecast to 2030(US$ Million) - by Operation Type

Table 20. South Korea: Worm Gear Drives Market - Revenue and Forecast to 2030(US$ Million) - by Product Type

Table 21. South Korea: Worm Gear Drives Market - Revenue and Forecast to 2030(US$ Million) - by Material Type

Table 22. Rest of Asia Pacific: Worm Gear Drives Market - Revenue and Forecast to 2030(US$ Million) - by Operation Type

Table 23. Rest of Asia Pacific: Worm Gear Drives Market - Revenue and Forecast to 2030(US$ Million) - by Product Type

Table 24. Rest of Asia Pacific: Worm Gear Drives Market - Revenue and Forecast to 2030(US$ Million) - by Material Type

List of Figures

Figure 1. Worm Gear Drives Market Segmentation, by Country

Figure 2. PEST Analysis

Figure 3. Worm Gear Drives Market - Key Market Dynamics

Figure 4. Impact Analysis of Drivers and Restraints

Figure 5. Worm Gear Drives Market Revenue (US$ Million), 2020-2030

Figure 6. Worm Gear Drives Market Share (%) - by Operation Type (2022 and 2030)

Figure 7. Cylindrical Worm Gear: Worm Gear Drives Market - Revenue and Forecast to 2030 (US$ Million)

Figure 8. Single and Double Enveloping Worm Gear: Worm Gear Drives Market - Revenue and Forecast to 2030 (US$ Million)

Figure 9. Worm Gear Drives Market Share (%) - by Product Type (2022 and 2030)

Figure 10. Housed Units: Worm Gear Drives Market - Revenue and Forecast to 2030 (US$ Million)

Figure 11. Gearsets: Worm Gear Drives Market - Revenue and Forecast to 2030 (US$ Million)

Figure 12. High Speed Worms: Worm Gear Drives Market - Revenue and Forecast to 2030 (US$ Million)

Figure 13. Worm Gear Drives Market Share (%) - by Material Type (2022 and 2030)

Figure 14. Stainless Steel: Worm Gear Drives Market - Revenue and Forecast to 2030 (US$ Million)

Figure 15. Cast Iron: Worm Gear Drives Market - Revenue and Forecast to 2030 (US$ Million)

Figure 16. Aluminum: Worm Gear Drives Market - Revenue and Forecast to 2030 (US$ Million)

Figure 17. Others: Worm Gear Drives Market - Revenue and Forecast to 2030 (US$ Million)

Figure 18. Asia Pacific Worm Gear Drives Market, by Key Countries - Revenue (2022) (US$ Million)

Figure 19. Asia Pacific Worm Gear Drives Market Breakdown, by Key Countries, 2022 and 2030 (%)

Figure 20. Australia: Worm Gear Drives Market - Revenue and Forecast to 2030(US$ Million)

Figure 21. China: Worm Gear Drives Market - Revenue and Forecast to 2030(US$ Million)

Figure 22. India: Worm Gear Drives Market - Revenue and Forecast to 2030(US$ Million)

Figure 23. Japan: Worm Gear Drives Market - Revenue and Forecast to 2030(US$ Million)

Figure 24. South Korea: Worm Gear Drives Market - Revenue and Forecast to 2030(US$ Million)

Figure 25. Rest of Asia Pacific: Worm Gear Drives Market - Revenue and Forecast to 2030(US$ Million)

Figure 26. Heat Map Analysis, by Key Players

Figure 27. Company Positioning & Concentration

1. Kohara Gear Industry Co Ltd.
2. Tulsa Winch Inc.
3. Nozag AG.
4. The Timken Co.
5. Tracey Gear Inc.

  • Save and reduce time carrying out entry-level research by identifying the growth, size, leading players, and segments in the Asia Pacific worm gear drives market.
  • Highlights key business priorities in order to assist companies to realign their business strategies.
  • The key findings and recommendations highlight crucial progressive industry trends in the Asia Pacific worm gear drives market, thereby allowing players across the value chain to develop effective long-term strategies.
  • Develop/modify business expansion plans by using substantial growth offering developed and emerging markets.
  • Scrutinize in-depth Asia Pacific market trends and outlook coupled with the factors driving the Asia Pacific worm gear drives market, as well as those hindering it.
  • Enhance the decision-making process by understanding the strategies that underpin commercial interest with respect to client products, segmentation, pricing, and distribution.
Report Code
Full Name
Country Name
Email Id
Phone Number
Job Title
Company
Requirement

Note : Your data will never be shared with third parties, however, we may send you information from time to time about our products that may be of interest to you. By submitting your details, you agree to be contacted by us. You may contact us at any time to opt-out.


Purchase Options
Single User License
$3550
$2485
Site License
$4550
$3185
Enterprise License
$5550
$3885