アジア太平洋バニラエキス市場の2030年までの予測 - 地域別分析 - 形態別(粉末および液体)、カテゴリ別(オーガニックおよび従来型)、用途別(食品および飲料[ベーカリーおよび菓子、乳製品および冷凍デザート、飲料、甘味および風味スナック、その他]、パーソナルケア、その他)

BMIRE00030149 | Pages: 75 | Food and Beverages | May 2024 | Type: Regional | Status: Published

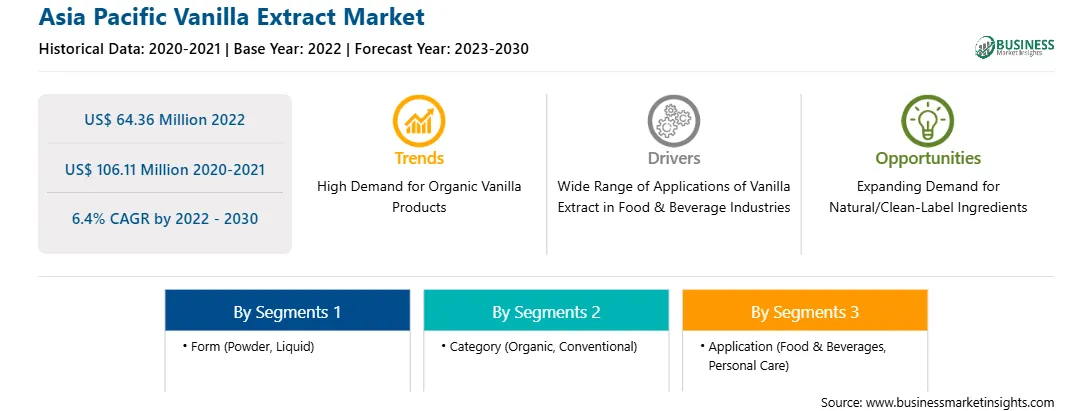
アジア太平洋地域のバニラエキス市場は、2022年に6,436万米ドルと評価され、2030年までに1億611万米ドルに達すると予想されています。また、2022年から2030年にかけて6.4%のCAGRを記録すると推定されています。

天然/クリーンラベル成分の需要拡大がアジア太平洋地域のバニラエキス市場を牽引

世界中の消費者は、より健康的なライフスタイルの採用に傾倒しています。天然フレーバーは、消費者の食事要件を満たすことができます。メニューの説明や食品パッケージのラベルは、消費者の好みに大きく影響します。消費者は防腐剤、人工着色料、香料などの合成成分を含まない100%天然製品を好むため、クリーンラベル製品の人気が高まっています。

消費者の需要と国際規制により、さまざまなアプリケーション産業は、安全で持続可能な製品を生産するために天然源からの有効成分を求めるようになりました。したがって、バニラエキスの製造業者は、天然およびクリーンラベル成分の需要の高まりを満たすために、製品ポートフォリオを拡大しています。

したがって、天然およびクリーンラベルの原料に対する需要の高まりは、予測期間中にアジア太平洋のバニラエキス市場に有利な機会を提供すると予想されます。

アジア太平洋のバニラエキス市場の概要

アジア太平洋のその他のバニラエキス市場は、シンガポール、インドネシア、タイ、マレーシア、ニュージーランドなどに分割されています。これらの国では、消費者の天然およびオーガニック食品の人気の高まりにより、バニラエキス市場の大幅な成長が見込まれています。シンガポール、インドネシア、タイ、マレーシアは、芳香療法で有名な数少ない国です。これらの国の多くのスパ、美容クリニック、マッサージセンター、アロマセラピーセンターでは、治癒、保湿、鎮静特性を持つバニラエキスを含むエッセンシャルオイルを使用しています。さらに、天然の解毒クリーナーや消毒剤の採用の増加により、バニラエキスの需要が加速すると予想されます。

アジア太平洋地域のバニラエキス市場の収益と2030年までの予測(百万米ドル)

アジア太平洋地域のバニラエキス市場のセグメンテーション

アジア太平洋地域のバニラエキス市場は、形態、カテゴリー、用途、国に基づいてセグメント化されています。形態に基づいて、アジア太平洋地域のバニラエキス市場は粉末と液体に分かれています。液体セグメントは2022年に大きな市場シェアを占めました。

カテゴリー別では、アジア太平洋地域のバニラエキス市場は有機と従来に分かれています。従来セグメントは2022年に大きな市場シェアを占めました。

用途別に、アジア太平洋地域のバニラエキス市場は、食品・飲料、パーソナルケア、その他に分類されています。食品・飲料セグメントは2022年に最大の市場シェアを占めました。さらに、食品・飲料セグメントは、ベーカリー・菓子、乳製品・冷凍デザート、飲料、甘味・香ばしいスナック、その他に分類されています。

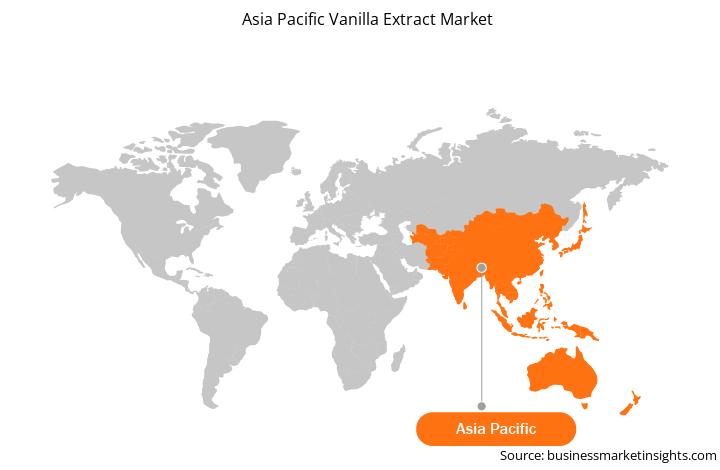
国別に見ると、アジア太平洋のバニラエキス市場は、中国、日本、インド、オーストラリア、韓国、東南アジア、その他のアジア太平洋地域に分かれています。2022年には、その他のアジア太平洋地域がアジア太平洋のバニラエキス市場シェアを独占しました。

Prova SAS、Tharakan and Co、Natural Vanilla Pty Ltd、Kerry Group Plc、Archer-Daniels-Midland Co、Synergy Flavors Incは、アジア太平洋のバニラエキス市場で活動する大手企業の一部です。

1.           Introduction

1.1       The Insight Partners Research Report Guidance

1.2       Market Segmentation

2.           Executive Summary

2.1       Key Market Insights

2.2       Market Attractiveness

3.           Research Methodology

3.1       Coverage

3.2       Secondary Research

3.3       Primary Research

4.           Asia Pacific Vanilla Extract Market Landscape

4.1       Overview

4.2       Porter's Five Forces Analysis

4.2.1         Bargaining Power of Suppliers

4.2.2         Bargaining Power of Buyers

4.2.3         Threat of New Entrants

4.2.4         Competitive Rivalry

4.2.5         Threat of Substitutes

4.3       Ecosystem Analysis

4.3.1         Raw Material Suppliers

4.3.2         Manufacturing Process

4.3.3         Distributors or Suppliers

4.3.4         Application

5.           Asia Pacific Vanilla Extract Market - Key Industry Dynamics

5.1       Market Drivers

5.1.1         Wide Range of Applications of Vanilla Extract in Food & Beverage Industries

5.1.2         Rising Adoption of Vanilla Extract in Personal Care

5.2       Market Restraints

5.2.1         Price Volatility and Supply Shortage

5.3       Market Opportunities

5.3.1         Expanding Demand for Natural/Clean-Label Ingredients

5.4       Future Trends

5.4.1         High Demand for Organic Vanilla Products

5.5       Impact Analysis of Drivers and Restraints

6.           Vanilla Extract Market - Asia Pacific Market Analysis

6.1       Asia Pacific Vanilla Extract Market Overview

6.2       Asia Pacific Vanilla Extract Market Revenue (US$ Thousand), 2020 – 2030

6.3       Vanilla Extract Market Forecast and Analysis

7.           Asia Pacific Vanilla Extract Market Analysis – Form

7.1       Liquid

7.1.1         Overview

7.1.2         Liquid Market Revenue and Forecast to 2030 (US$ Thousand)

7.2       Powder

7.2.1         Overview

7.2.2         Powder Market Revenue and Forecast to 2030 (US$ Thousand)

8.           Asia Pacific Vanilla Extract Market Analysis – Category

8.1       Organic

8.1.1         Overview

8.1.2         Organic Market Revenue and Forecast to 2030 (US$ Thousand)

8.2       Conventional

8.2.1         Overview

8.2.2         Conventional Market Revenue and Forecast to 2030 (US$ Thousand)

9.           Asia Pacific Vanilla Extract Market Analysis – Application

9.1       Food & Beverages

9.1.1         Overview

9.1.2         Food & Beverages Market Revenue and Forecast to 2030 (US$ Thousand)

9.1.2.1            Bakery & Confectionery

9.1.2.1.1           Overview

9.1.2.1.2           Bakery & Confectionery Market Revenue and Forecast to 2030 (US$ Thousand)

9.1.2.2            Dairy & Frozen Desserts

9.1.2.2.1           Overview

9.1.2.2.2           Dairy & Frozen Desserts Market Revenue and Forecast to 2030 (US$ Thousand)

9.1.2.3            Beverages

9.1.2.3.1           Overview

9.1.2.3.2           Beverages Market Revenue and Forecast to 2030 (US$ Thousand)

9.1.2.4            Sweet & Savory Snacks

9.1.2.4.1           Overview

9.1.2.4.2           Sweet & Savory Snacks Market Revenue and Forecast to 2030 (US$ Thousand)

9.1.2.5            Others

9.1.2.5.1           Overview

9.1.2.5.2           Others Market Revenue and Forecast to 2030 (US$ Thousand)

9.2       Personal Care

9.2.1         Overview

9.2.2         Personal Care Market Revenue and Forecast to 2030 (US$ Thousand)

9.3       Others

9.3.1         Overview

9.3.2         Others Market Revenue and Forecast to 2030 (US$ Thousand)

10.        Asia Pacific Vanilla Extract Market - Country Analysis

10.1     Asia Pacific

10.1.1       Asia Pacific Vanilla Extract Market Revenue and Forecasts and Analysis - By Countries

10.1.1.1          Asia Pacific Vanilla Extract Market Breakdown by Country

10.1.1.2          China Vanilla Extract Market Revenue and Forecasts to 2030 (US$ Thousand)

10.1.1.2.1        China Vanilla Extract Market Breakdown by Form

10.1.1.2.2        China Vanilla Extract Market Breakdown by Category

10.1.1.2.3        China Vanilla Extract Market Breakdown by Application

10.1.1.3          India Vanilla Extract Market Revenue and Forecasts to 2030 (US$ Thousand)

10.1.1.3.1        India Vanilla Extract Market Breakdown by Form

10.1.1.3.2        India Vanilla Extract Market Breakdown by Category

10.1.1.3.3        India Vanilla Extract Market Breakdown by Application

10.1.1.4          Japan Vanilla Extract Market Revenue and Forecasts to 2030 (US$ Thousand)

10.1.1.4.1        Japan Vanilla Extract Market Breakdown by Form

10.1.1.4.2        Japan Vanilla Extract Market Breakdown by Category

10.1.1.4.3        Japan Vanilla Extract Market Breakdown by Application

10.1.1.5          Australia Vanilla Extract Market Revenue and Forecasts to 2030 (US$ Thousand)

10.1.1.5.1        Australia Vanilla Extract Market Breakdown by Form

10.1.1.5.2        Australia Vanilla Extract Market Breakdown by Category

10.1.1.5.3        Australia Vanilla Extract Market Breakdown by Application

10.1.1.6          South Korea Vanilla Extract Market Revenue and Forecasts to 2030 (US$ Thousand)

10.1.1.6.1        South Korea Vanilla Extract Market Breakdown by Form

10.1.1.6.2        South Korea Vanilla Extract Market Breakdown by Category

10.1.1.6.3        South Korea Vanilla Extract Market Breakdown by Application

10.1.1.7          Southeast Asia Vanilla Extract Market Revenue and Forecasts to 2030 (US$ Thousand)

10.1.1.7.1        Southeast Asia Vanilla Extract Market Breakdown by Form

10.1.1.7.2        Southeast Asia Vanilla Extract Market Breakdown by Category

10.1.1.7.3        Southeast Asia Vanilla Extract Market Breakdown by Application

10.1.1.8          Rest of Asia Pacific Vanilla Extract Market Revenue and Forecasts to 2030 (US$ Thousand)

10.1.1.8.1        Rest of Asia Pacific Vanilla Extract Market Breakdown by Form

10.1.1.8.2        Rest of Asia Pacific Vanilla Extract Market Breakdown by Category

10.1.1.8.3        Rest of Asia Pacific Vanilla Extract Market Breakdown by Application

11.        Company Profiles

11.1     Prova SAS

11.1.1       Key Facts

11.1.2       Business Description

11.1.3       Products and Services

11.1.4       Financial Overview

11.1.5       SWOT Analysis

11.1.6       Key Developments

11.2     Tharakan and Co

11.2.1       Key Facts

11.2.2       Business Description

11.2.3       Products and Services

11.2.4       Financial Overview

11.2.5       SWOT Analysis

11.2.6       Key Developments

11.3     Natural Vanilla Pty Ltd

11.3.1       Key Facts

11.3.2       Business Description

11.3.3       Products and Services

11.3.4       Financial Overview

11.3.5       SWOT Analysis

11.3.6       Key Developments

11.4     Kerry Group Plc

11.4.1       Key Facts

11.4.2       Business Description

11.4.3       Products and Services

11.4.4       Financial Overview

11.4.5       SWOT Analysis

11.4.6       Key Developments

11.5     Archer-Daniels-Midland Co

11.5.1       Key Facts

11.5.2       Business Description

11.5.3       Products and Services

11.5.4       Financial Overview

11.5.5       SWOT Analysis

11.5.6       Key Developments

11.6     Synergy Flavors Inc

11.6.1       Key Facts

11.6.2       Business Description

11.6.3       Products and Services

11.6.4       Financial Overview

11.6.5       SWOT Analysis

11.6.6       Key Developments

12.        Appendix


List of Tables

Table 1.             Vanilla Extract Market Segmentation

Table 2.             Vanilla Extract Market Revenue and Forecasts to 2030 (US$ Thousand)

Table 3.             Asia Pacific Vanilla Extract Market Revenue and Forecasts to 2030 (US$ Thousand) – Form

Table 4.             Asia Pacific Vanilla Extract Market Revenue and Forecasts to 2030 (US$ Thousand) – Category

Table 5.             Asia Pacific Vanilla Extract Market Revenue and Forecasts to 2030 (US$ Thousand) – Application

Table 6.             China Vanilla Extract Market Revenue and Forecasts to 2030 (US$ Thousand) – By Form

Table 7.             China Vanilla Extract Market Revenue and Forecasts to 2030 (US$ Thousand) – By Category

Table 8.             China Vanilla Extract Market Revenue and Forecasts to 2030 (US$ Thousand) – By Application

Table 9.             India Vanilla Extract Market Revenue and Forecasts to 2030 (US$ Thousand) – By Form

Table 10.          India Vanilla Extract Market Revenue and Forecasts to 2030 (US$ Thousand) – By Category

Table 11.          India Vanilla Extract Market Revenue and Forecasts to 2030 (US$ Thousand) – By Application

Table 12.          Japan Vanilla Extract Market Revenue and Forecasts to 2030 (US$ Thousand) – By Form

Table 13.          Japan Vanilla Extract Market Revenue and Forecasts to 2030 (US$ Thousand) – By Category

Table 14.          Japan Vanilla Extract Market Revenue and Forecasts to 2030 (US$ Thousand) – By Application

Table 15.          Australia Vanilla Extract Market Revenue and Forecasts to 2030 (US$ Thousand) – By Form

Table 16.          Australia Vanilla Extract Market Revenue and Forecasts to 2030 (US$ Thousand) – By Category

Table 17.          Australia Vanilla Extract Market Revenue and Forecasts to 2030 (US$ Thousand) – By Application

Table 18.          South Korea Vanilla Extract Market Revenue and Forecasts to 2030 (US$ Thousand) – By Form

Table 19.          South Korea Vanilla Extract Market Revenue and Forecasts to 2030 (US$ Thousand) – By Category

Table 20.          South Korea Vanilla Extract Market Revenue and Forecasts to 2030 (US$ Thousand) – By Application

Table 21.          Southeast Asia Vanilla Extract Market Revenue and Forecasts to 2030 (US$ Thousand) – By Form

Table 22.          Southeast Asia Vanilla Extract Market Revenue and Forecasts to 2030 (US$ Thousand) – By Category

Table 23.          Southeast Asia Vanilla Extract Market Revenue and Forecasts to 2030 (US$ Thousand) – By Application

Table 24.          Rest of Asia Pacific Vanilla Extract Market Revenue and Forecasts to 2030 (US$ Thousand) – By Form

Table 25.          Rest of Asia Pacific Vanilla Extract Market Revenue and Forecasts to 2030 (US$ Thousand) – By Category

Table 26.          Rest of Asia Pacific Vanilla Extract Market Revenue and Forecasts to 2030 (US$ Thousand) – By Application


List of Figures

Figure 1.           Vanilla Extract Market Segmentation, By Country

Figure 2.           Porter's Five Forces Analysis

Figure 3.           Ecosystem: Vanilla Extract Market

Figure 4.           Vanilla Extract Market - Key Industry Dynamics

Figure 5.           Asia Pacific Vanilla Extract Market Impact Analysis of Drivers and Restraints

Figure 6.           Asia Pacific Vanilla Extract Market Revenue (US$ Thousand), 2020 – 2030

Figure 7.           Asia Pacific Vanilla Extract Market Share (%) – Form, 2022 and 2030

Figure 8.           Liquid Market Revenue and Forecasts to 2030 (US$ Thousand)

Figure 9.           Powder Market Revenue and Forecasts to 2030 (US$ Thousand)

Figure 10.        Asia Pacific Vanilla Extract Market Share (%) –Category, 2022 and 2030

Figure 11.        Organic Market Revenue and Forecasts to 2030 (US$ Thousand)

Figure 12.        Conventional Market Revenue and Forecasts to 2030 (US$ Thousand)

Figure 13.        Asia Pacific Vanilla Extract Market Share (%) –Application, 2022 and 2030

Figure 14.        Food & Beverages Market Revenue and Forecasts to 2030 (US$ Thousand)

Figure 15.        Bakery & Confectionery Market Revenue and Forecasts to 2030 (US$ Thousand)

Figure 16.        Dairy & Frozen Desserts Market Revenue and Forecasts to 2030 (US$ Thousand)

Figure 17.        Beverages Market Revenue and Forecasts to 2030 (US$ Thousand)

Figure 18.        Sweet & Savory Snacks Market Revenue and Forecasts to 2030 (US$ Thousand)

Figure 19.        Others Market Revenue and Forecasts to 2030 (US$ Thousand)

Figure 20.        Personal Care Market Revenue and Forecasts to 2030 (US$ Thousand)

Figure 21.        Others Market Revenue and Forecasts to 2030 (US$ Thousand)

Figure 22.        Asia Pacific Vanilla Extract Market, by Key Countries – Revenue (2022) (US$ Thousand)

Figure 23.        Asia Pacific Vanilla Extract Market Breakdown by Key Countries, 2022 and 2030 (%)

Figure 24.        China Vanilla Extract Market Revenue and Forecasts to 2030 (US$ Thousand)

Figure 25.        India Vanilla Extract Market Revenue and Forecasts to 2030 (US$ Thousand)

Figure 26.        Japan Vanilla Extract Market Revenue and Forecasts to 2030 (US$ Thousand)

Figure 27.        Australia Vanilla Extract Market Revenue and Forecasts to 2030 (US$ Thousand)

Figure 28.        South Korea Vanilla Extract Market Revenue and Forecasts to 2030 (US$ Thousand)

Figure 29.        Southeast Asia Vanilla Extract Market Revenue and Forecasts to 2030 (US$ Thousand)

Figure 30.        Rest of Asia Pacific Vanilla Extract Market Revenue and Forecasts to 2030 (US$ Thousand)

1. Prova SAS

2. Tharakan and Co

3. Natural Vanilla Pty Ltd

4. Kerry Group Plc

5. Archer-Daniels-Midland Co

6. Synergy Flavors Inc


  • Save and reduce time carrying out entry-level research by identifying the growth, size, leading players, and segments in the Asia Pacific vanilla extract market.
  • Highlights key business priorities in order to assist companies to realign their business strategies.
  • The key findings and recommendations highlight crucial progressive industry trends in the Asia Pacific vanilla extract market, thereby allowing players across the value chain to develop effective long-term strategies.
  • Develop/modify business expansion plans by using substantial growth offering developed and emerging markets.
  • Scrutinize in-depth Asia Pacific market trends and outlook coupled with the factors driving the Asia Pacific vanilla extract market, as well as those hindering it.
  • Enhance the decision-making process by understanding the strategies that underpin commercial interest with respect to client products, segmentation, pricing, and distribution.
Report Code
Full Name
Country Name
Email Id
Phone Number
Job Title
Company
Requirement

Note : Your data will never be shared with third parties, however, we may send you information from time to time about our products that may be of interest to you. By submitting your details, you agree to be contacted by us. You may contact us at any time to opt-out.


Purchase Options
Single User License
$3550
$2485
Site License
$4550
$3185
Enterprise License
$5550
$3885