アジア太平洋地域の追跡およびトレース ソリューション市場予測 (2030 年まで) - 地域分析 - コンポーネント (ハードウェアとソフトウェア)、企業規模 (中小企業と大企業)、アプリケーション (シリアル化と集約)、エンド ユーザー (医薬品、医療機器、消費財、食品および飲料、その他) 別

BMIRE00030388 | Pages: 111 | Healthcare IT | Jul 2024 | Type: Regional | Status: Published

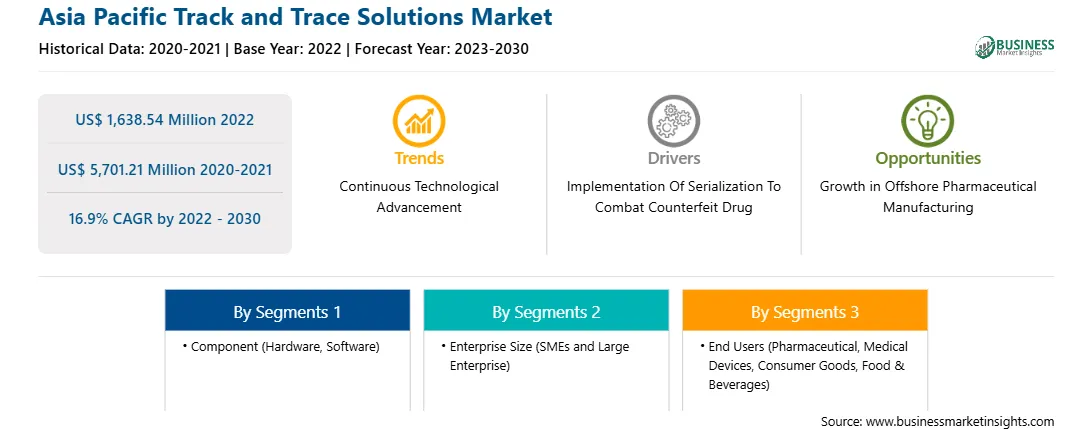
アジア太平洋地域の追跡およびトレース ソリューション市場は、2022 年に 16 億 3,854 万米ドルと評価され、2030 年までに 57 億 121 万米ドルに達すると予想されています。また、2022 年から 2030 年にかけて 16.9% の CAGR を記録すると予測されています。

オフショア医薬品製造の成長がアジア太平洋地域の追跡およびトレース ソリューション市場を後押し

オフショア契約製造は、医薬品製造の生産性と効率性の向上を目指す大手製薬会社向けです。発展途上国は医薬品施設とサービスを大幅に開発しており、技術の進歩に向かっています。インドの医薬品市場は継続的に成長しており、同国のジェネリック医薬品メーカーは世界のサプライ チェーンで強力な地位を占めています。

これらの企業は、インドにおける業界の発展に極めて重要な役割を果たしています。インドの製薬製造会社は、ジェネリック医薬品の世界最大の供給元の一つであり、さまざまなワクチンの世界需要の50%、米国のジェネリック市場の40%、英国の医薬品全体の25%を供給しています。

FDAによると、米国はバイオメディカル研究への投資を通じて、新薬の発見と開発の世界的リーダーになりましたが、医薬品製造の最前線にいることはもうありません。歴史的に、米国民のための医薬品の生産は国内で行われてきました。しかし、ここ数十年で医薬品製造は徐々に国外に移っています。これは、錠剤、カプセル、注射剤などに配合される実際の医薬品である医薬品有効成分(API)の製造業者に特に当てはまります。2019年8月現在、製造施設のわずか28%が米国市場に供給するAPIを製造していました。対照的に、米国市場に供給するAPI製造業者の72%は海外にあり、13%は中国にありました。中国は現在、世界で生産される API の約 40% を占めており、ヨーロッパなどの外部市場は、中国企業にとって、手頃な価格のジェネリック医薬品や API のさらなる市場の可能性を提供しています。ここでの計画は、既存の製品を EU で販売できるように改造することかもしれません。場合によっては、製造業務を移転したり、ヨーロッパのブランドと現地で販売パートナーシップを結んだりするかもしれません。

多くの業界では、世界経済大国としての中国の着実な台頭により、生産と需要の両方で世界有数の原動力の 1 つに変貌しました。中国では、小さな経済変動でも、世界中のさまざまなセクターに波及効果をもたらす可能性があります。中国は、重工業中心からサービスベースのモデルへの経済移行を続けており、医療サービスの提供はますます高い優先順位を与えられています。

中国の医療市場は 2 桁の成長を遂げています。しかし、中国の GDP に占める医療費の割合が比較的低い (米国、ヨーロッパ、日本では 10% から 17% の範囲であるのに対し、中国では約 6% です) ことから、市場がさらに拡大する余地がまだあることがわかります。中国のヘルスケアは企業にとってますます魅力的になっています。製造プロセスのオフショア化は魅力的なコスト削減オプションです。したがって、コスト効率の高い製品で市場に参入するプレーヤーの機会は高くなっています。

アジア太平洋地域のトラック&トレースソリューション市場の概要

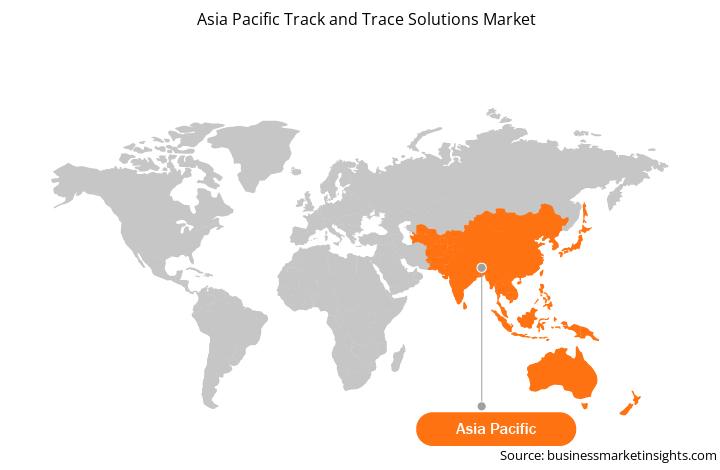
アジア太平洋地域のトラック&トレースソリューション市場は、中国、日本、インド、韓国、オーストラリア、その他のアジア太平洋地域に分かれています。2022年には中国が最大の市場シェアを占め、インドは市場で大幅な成長ペースを示すことが予想されています。これらの国の市場成長は、医薬品、食品・飲料、消費財のトラック&トレースソリューションを対象とした有利な政策に起因しています。さらに、市場プレーヤーが実施した拡張および製品発売戦略は、この地域のトラック&トレースソリューション市場の成長に貢献しています。

多くの業界で、トラック&トレースソリューションは、製造、製品品質、顧客満足度に関連する品質管理の問題を解決します。

たとえば、中国には、複雑な製品マスターデータ、企業マスターデータ、生産/流通および運用データに関する義務があり、これらを収集、整理、報告する必要があります。中国国家品質監督総局によると、医療製品の品質の電子監視は、特に国務院による食品安全監督管理を強化することにより、特別な規定を通じて行う必要があります。

アジア太平洋地域のトラックアンドトレースソリューション市場の収益と2030年までの予測(百万米ドル)

アジア太平洋地域のトラックアンドトレースソリューション市場のセグメンテーション

アジア太平洋地域のトラックアンドトレースソリューション市場は、コンポーネント、企業規模、アプリケーション、エンドユーザー、および国に分類されています。

コンポーネントに基づいて、アジア太平洋地域のトラックアンドトレースソリューション市場は、ハードウェアとソフトウェアに分かれています。ソフトウェアセグメントは、2022年にアジア太平洋地域のトラックアンドトレースソリューション市場でより大きなシェアを占めました。さらに、ソフトウェアセグメントは、プラントマネージャー、ラインコントローラー、その他にサブカテゴリ化されています。さらに、ハードウェアセグメントは、バーコードスキャナー、無線周波数識別(RFID)リーダー、およびその他のサブセグメントに分割されています。

企業規模では、アジア太平洋地域の追跡およびトレースソリューション市場は中小企業と大企業に分割されています。大企業セグメントは、2022年にアジア太平洋地域の追跡およびトレースソリューションの市場シェアを大きく占めました。

アプリケーション別に見ると、アジア太平洋地域の追跡およびトレースソリューション市場は、シリアル化ソリューションと集約ソリューションに分かれています。シリアル化ソリューションセグメントは、2022年にアジア太平洋地域の追跡およびトレースソリューションの市場シェアを大きく占めました。

エンドユーザーの観点から見ると、アジア太平洋地域の追跡およびトレースソリューション市場は、医薬品、医療機器、消費財、食品および飲料、その他に分類されています。医薬品セグメントは、2022年にアジア太平洋地域の追跡およびトレースソリューションの市場シェアで最大でした。

国別に見ると、アジア太平洋地域の追跡およびトレースソリューション市場は、中国、日本、インド、韓国、オーストラリア、その他のアジア太平洋地域に分類されています。 2022年、アジア太平洋地域の追跡およびトレースのソリューション市場シェアは中国が独占しました。

SAP SE、Uhlmann Pac-Systeme GmbH & Co KG、WIPOTEC GmbH、Bar Code India Ltd、Korber AG、Videojet Technologies Inc、Domino Printing Sciences plc、Kezzler AS、rfxcel Corp、NeuroTags Inc、Jekson Vison Pvt Ltd.は、アジア太平洋地域の追跡およびトレースのソリューション市場で事業を展開している大手企業の一部です。

TABLE OF CONTENTS


1. Introduction

1.1 The Insight Partners Research Report Guidance

1.2 Market Segmentation

2. Executive Summary

2.1 Key Insights

3. Research Methodology

3.1 Coverage

3.2 Secondary Research

3.3 Primary Research

4. Asia Pacific Track and Trace Solutions Market - Key Market Dynamics

4.1 Asia Pacific Track and Trace Solutions Market - Key Market Dynamics

4.2 Market Drivers

4.2.1 Implementation of Serialization to Combat Counterfeit Drugs

4.2.2 Increasing Number of Packaging-Related Product Recalls

4.3 Market Restraints

4.3.1 High Cost of Products and Implementation

4.4 Market Opportunities

4.4.1 Growth in Offshore Pharmaceutical Manufacturing

4.4.2 Supply Chain Optimization

4.5 Future Trends

4.5.1 Continuous Technological Advancements

4.6 Impact of Drivers and Restraints:

5. Track and Trace Solutions Market - Asia Pacific Market Analysis

5.1 Asia Pacific Track and Trace Solutions Market Revenue (US$ Million), 2020-2030

5.2 Asia Pacific Track and Trace Solutions Market Forecast Analysis

6. Asia Pacific Track and Trace Solutions Market Analysis - by Component

6.1 Software

6.1.1 Overview

6.1.2 Software: Asia Pacific Track and Trace Solutions Market - Revenue and Forecast to 2030 (US$ Million)

6.2 Hardware

6.2.1 Overview

6.2.2 Hardware: Asia Pacific Track and Trace Solutions Market - Revenue and Forecast to 2030 (US$ Million)

7. Asia Pacific Track and Trace Solutions Market Analysis - by Application

7.1 Serialization Solution

7.1.1 Overview

7.1.2 Serialization Solution: Asia Pacific Track and Trace Solutions Market - Revenue and Forecast to 2030 (US$ Million)

7.2 Aggregation Solution

7.2.1 Overview

7.2.2 Aggregation Solution: Asia Pacific Track and Trace Solutions Market - Revenue and Forecast to 2030 (US$ Million)

8. Asia Pacific Track and Trace Solutions Market Analysis - by Enterprises Size

8.1 SMEs

8.1.1 Overview

8.1.2 SMEs: Asia Pacific Track and Trace Solutions Market - Revenue and Forecast to 2030 (US$ Million)

8.2 Large Enterprises

8.2.1 Overview

8.2.2 Large Enterprises: Asia Pacific Track and Trace Solutions Market - Revenue and Forecast to 2030 (US$ Million)

9. Asia Pacific Track and Trace Solutions Market Analysis - by End Users

9.1 Pharmaceutical

9.1.1 Overview

9.1.2 Pharmaceutical: Asia Pacific Track and Trace Solutions Market - Revenue and Forecast to 2030 (US$ Million)

9.2 Medical Devices

9.2.1 Overview

9.2.2 Medical Devices: Asia Pacific Track and Trace Solutions Market - Revenue and Forecast to 2030 (US$ Million)

9.3 Consumer Goods

9.3.1 Overview

9.3.2 Consumer Goods: Asia Pacific Track and Trace Solutions Market - Revenue and Forecast to 2030 (US$ Million)

9.4 Food and Beverages

9.4.1 Overview

9.4.2 Food and Beverages: Asia Pacific Track and Trace Solutions Market - Revenue and Forecast to 2030 (US$ Million)

9.5 Others

9.5.1 Overview

9.5.2 Others: Asia Pacific Track and Trace Solutions Market - Revenue and Forecast to 2030 (US$ Million)

10. Asia Pacific Track and Trace Solutions Market - Country Analysis

10.1 Asia Pacific

10.1.1 Asia Pacific: Track and Trace Solutions Market - Revenue and Forecast Analysis - by Country

10.1.1.1 China: Track and Trace Solutions Market - Revenue and Forecast to 2030 (US$ Million)

10.1.1.1.1 China: Track and Trace Solutions Market Breakdown, by Component

10.1.1.1.1.1 China: Track and Trace Solutions Market Breakdown, by Software

10.1.1.1.1.2 China: Track and Trace Solutions Market Breakdown, by Hardware

10.1.1.1.2 China: Track and Trace Solutions Market Breakdown, by Application

10.1.1.1.3 China: Track and Trace Solutions Market Breakdown, by Enterprises Size

10.1.1.1.4 China: Track and Trace Solutions Market Breakdown, by End Users

10.1.1.2 Japan: Track and Trace Solutions Market - Revenue and Forecast to 2030 (US$ Million)

10.1.1.2.1 Japan: Track and Trace Solutions Market Breakdown, by Component

10.1.1.2.1.1 Japan: Track and Trace Solutions Market Breakdown, by Software

10.1.1.2.1.2 Japan: Track and Trace Solutions Market Breakdown, by Hardware

10.1.1.2.2 Japan: Track and Trace Solutions Market Breakdown, by Application

10.1.1.2.3 Japan: Track and Trace Solutions Market Breakdown, by Enterprises Size

10.1.1.2.4 Japan: Track and Trace Solutions Market Breakdown, by End Users

10.1.1.3 India: Track and Trace Solutions Market - Revenue and Forecast to 2030 (US$ Million)

10.1.1.3.1 India: Track and Trace Solutions Market Breakdown, by Component

10.1.1.3.1.1 India: Track and Trace Solutions Market Breakdown, by Software

10.1.1.3.1.2 India: Track and Trace Solutions Market Breakdown, by Hardware

10.1.1.3.2 India: Track and Trace Solutions Market Breakdown, by Application

10.1.1.3.3 India: Track and Trace Solutions Market Breakdown, by Enterprises Size

10.1.1.3.4 India: Track and Trace Solutions Market Breakdown, by End Users

10.1.1.4 South Korea: Track and Trace Solutions Market - Revenue and Forecast to 2030 (US$ Million)

10.1.1.4.1 South Korea: Track and Trace Solutions Market Breakdown, by Component

10.1.1.4.1.1 South Korea: Track and Trace Solutions Market Breakdown, by Software

10.1.1.4.1.2 South Korea: Track and Trace Solutions Market Breakdown, by Hardware

10.1.1.4.2 South Korea: Track and Trace Solutions Market Breakdown, by Application

10.1.1.4.3 South Korea: Track and Trace Solutions Market Breakdown, by Enterprises Size

10.1.1.4.4 South Korea: Track and Trace Solutions Market Breakdown, by End Users

10.1.1.5 Australia: Track and Trace Solutions Market - Revenue and Forecast to 2030 (US$ Million)

10.1.1.5.1 Australia: Track and Trace Solutions Market Breakdown, by Component

10.1.1.5.1.1 Australia: Track and Trace Solutions Market Breakdown, by Software

10.1.1.5.1.2 Australia: Track and Trace Solutions Market Breakdown, by Hardware

10.1.1.5.2 Australia: Track and Trace Solutions Market Breakdown, by Application

10.1.1.5.3 Australia: Track and Trace Solutions Market Breakdown, by Enterprises Size

10.1.1.5.4 Australia: Track and Trace Solutions Market Breakdown, by End Users

10.1.1.6 Rest of Asia Pacific: Track and Trace Solutions Market - Revenue and Forecast to 2030 (US$ Million)

10.1.1.6.1 Rest of Asia Pacific: Track and Trace Solutions Market Breakdown, by Component

10.1.1.6.1.1 Rest of Asia Pacific: Track and Trace Solutions Market Breakdown, by Software

10.1.1.6.1.2 Rest of Asia Pacific: Track and Trace Solutions Market Breakdown, by Hardware

10.1.1.6.2 Rest of Asia Pacific: Track and Trace Solutions Market Breakdown, by Application

10.1.1.6.3 Rest of Asia Pacific: Track and Trace Solutions Market Breakdown, by Enterprises Size

10.1.1.6.4 Rest of Asia Pacific: Track and Trace Solutions Market Breakdown, by End Users

11. Industry Landscape

11.1 Overview

11.2 Growth Strategies Done by the Companies in the Market, (%)

11.3 Organic Developments

11.3.1 Overview

11.4 Inorganic Developments

11.4.1 Overview

12. Company Profiles

12.1 SAP SE

12.1.1 Key Facts

12.1.2 Business Description

12.1.3 Products and Services

12.1.4 Financial Overview

12.1.5 SWOT Analysis

12.1.6 Key Developments

12.2 Uhlmann Pac-Systeme GmbH & Co KG

12.2.1 Key Facts

12.2.2 Business Description

12.2.3 Products and Services

12.2.4 Financial Overview

12.2.5 SWOT Analysis

12.2.6 Key Developments

12.3 WIPOTEC GmbH

12.3.1 Key Facts

12.3.2 Business Description

12.3.3 Products and Services

12.3.4 Financial Overview

12.3.5 SWOT Analysis

12.3.6 Key Developments

12.4 Bar Code India Ltd

12.4.1 Key Facts

12.4.2 Business Description

12.4.3 Products and Services

12.4.4 Financial Overview

12.4.5 SWOT Analysis

12.4.6 Key Developments

12.5 Korber AG

12.5.1 Key Facts

12.5.2 Business Description

12.5.3 Products and Services

12.5.4 Financial Overview

12.5.5 SWOT Analysis

12.5.6 Key Developments

12.6 Videojet Technologies Inc

12.6.1 Key Facts

12.6.2 Business Description

12.6.3 Products and Services

12.6.4 Financial Overview

12.6.5 SWOT Analysis

12.6.6 Key Developments

12.7 Domino Printing Sciences plc

12.7.1 Key Facts

12.7.2 Business Description

12.7.3 Products and Services

12.7.4 Financial Overview

12.7.5 SWOT Analysis

12.7.6 Key Developments

12.8 Kezzler AS

12.8.1 Key Facts

12.8.2 Business Description

12.8.3 Products and Services

12.8.4 Financial Overview

12.8.5 SWOT Analysis

12.8.6 Key Developments

12.9 rfxcel Corp

12.9.1 Key Facts

12.9.2 Business Description

12.9.3 Products and Services

12.9.4 Financial Overview

12.9.5 SWOT Analysis

12.9.6 Key Developments

12.10 NeuroTags Inc

12.10.1 Key Facts

12.10.2 Business Description

12.10.3 Products and Services

12.10.4 Financial Overview

12.10.5 SWOT Analysis

12.10.6 Key Developments

12.11 Jekson Vison Pvt Ltd

12.11.1 Key Facts

12.11.2 Business Description

12.11.3 Products and Services

12.11.4 Financial Overview

12.11.5 SWOT Analysis

12.11.6 Key Developments

13. Appendix

13.1 About Us

13.2 Glossary of Terms

List of Tables

Table 1. Asia Pacific Track and Trace Solutions Market Segmentation

Table 2. Asia Pacific Track and Trace Solutions Market - Revenue and Forecast to 2030 (US$ Million)

Table 3. Asia Pacific Track and Trace Solutions Market - Revenue and Forecast to 2030 (US$ Million) - by Component

Table 4. Asia Pacific Track and Trace Solutions Market - Revenue and Forecast to 2030 (US$ Million) - by Software

Table 5. Asia Pacific Track and Trace Solutions Market - Revenue and Forecast to 2030 (US$ Million) - by Hardware

Table 6. Asia Pacific Track and Trace Solutions Market - Revenue and Forecast to 2030 (US$ Million) - by Application

Table 7. Asia Pacific Track and Trace Solutions Market - Revenue and Forecast to 2030 (US$ Million) - by Enterprises Size

Table 8. Asia Pacific Track and Trace Solutions Market - Revenue and Forecast to 2030 (US$ Million) - by End Users

Table 9. China: Track and Trace Solutions Market - Revenue and Forecast to 2030(US$ Million) - by Component

Table 10. China: Track and Trace Solutions Market - Revenue and Forecast to 2030(US$ Million) - by Software

Table 11. China: Track and Trace Solutions Market - Revenue and Forecast to 2030(US$ Million) - by Hardware

Table 12. China: Track and Trace Solutions Market - Revenue and Forecast to 2030(US$ Million) - by Application

Table 13. China: Track and Trace Solutions Market - Revenue and Forecast to 2030(US$ Million) - by Enterprises Size

Table 14. China: Track and Trace Solutions Market - Revenue and Forecast to 2030(US$ Million) - by End Users

Table 15. Japan: Track and Trace Solutions Market - Revenue and Forecast to 2030(US$ Million) - by Component

Table 16. Japan: Track and Trace Solutions Market - Revenue and Forecast to 2030(US$ Million) - by Software

Table 17. Japan: Track and Trace Solutions Market - Revenue and Forecast to 2030(US$ Million) - by Hardware

Table 18. Japan: Track and Trace Solutions Market - Revenue and Forecast to 2030(US$ Million) - by Application

Table 19. Japan: Track and Trace Solutions Market - Revenue and Forecast to 2030(US$ Million) - by Enterprises Size

Table 20. Japan: Track and Trace Solutions Market - Revenue and Forecast to 2030(US$ Million) - by End Users

Table 21. India: Track and Trace Solutions Market - Revenue and Forecast to 2030(US$ Million) - by Component

Table 22. India: Track and Trace Solutions Market - Revenue and Forecast to 2030(US$ Million) - by Software

Table 23. India: Track and Trace Solutions Market - Revenue and Forecast to 2030(US$ Million) - by Hardware

Table 24. India: Track and Trace Solutions Market - Revenue and Forecast to 2030(US$ Million) - by Application

Table 25. India: Track and Trace Solutions Market - Revenue and Forecast to 2030(US$ Million) - by Enterprises Size

Table 26. India: Track and Trace Solutions Market - Revenue and Forecast to 2030(US$ Million) - by End Users

Table 27. South Korea: Track and Trace Solutions Market - Revenue and Forecast to 2030(US$ Million) - by Component

Table 28. South Korea: Track and Trace Solutions Market - Revenue and Forecast to 2030(US$ Million) - by Software

Table 29. South Korea: Track and Trace Solutions Market - Revenue and Forecast to 2030(US$ Million) - by Hardware

Table 30. South Korea: Track and Trace Solutions Market - Revenue and Forecast to 2030(US$ Million) - by Application

Table 31. South Korea: Track and Trace Solutions Market - Revenue and Forecast to 2030(US$ Million) - by Enterprises Size

Table 32. South Korea: Track and Trace Solutions Market - Revenue and Forecast to 2030(US$ Million) - by End Users

Table 33. Australia: Track and Trace Solutions Market - Revenue and Forecast to 2030(US$ Million) - by Component

Table 34. Australia: Track and Trace Solutions Market - Revenue and Forecast to 2030(US$ Million) - by Software

Table 35. Australia: Track and Trace Solutions Market - Revenue and Forecast to 2030(US$ Million) - by Hardware

Table 36. Australia: Track and Trace Solutions Market - Revenue and Forecast to 2030(US$ Million) - by Application

Table 37. Australia: Track and Trace Solutions Market - Revenue and Forecast to 2030(US$ Million) - by Enterprises Size

Table 38. Australia: Track and Trace Solutions Market - Revenue and Forecast to 2030(US$ Million) - by End Users

Table 39. Rest of Asia Pacific: Track and Trace Solutions Market - Revenue and Forecast to 2030(US$ Million) - by Component

Table 40. Rest of Asia Pacific: Track and Trace Solutions Market - Revenue and Forecast to 2030(US$ Million) - by Software

Table 41. Rest of Asia Pacific: Track and Trace Solutions Market - Revenue and Forecast to 2030(US$ Million) - by Hardware

Table 42. Rest of Asia Pacific: Track and Trace Solutions Market - Revenue and Forecast to 2030(US$ Million) - by Application

Table 43. Rest of Asia Pacific: Track and Trace Solutions Market - Revenue and Forecast to 2030(US$ Million) - by Enterprises Size

Table 44. Rest of Asia Pacific: Track and Trace Solutions Market - Revenue and Forecast to 2030(US$ Million) - by End Users

Table 45. Organic Developments Done by Companies

Table 46. Inorganic Developments Done by Companies

Table 47. Glossary of Terms, Track and Trace Market

List of Figures

Figure 1. Asia Pacific Track and Trace Solutions Market Segmentation, by Country

Figure 2. Impact Analysis of Drivers and Restraints

Figure 3. Asia Pacific Track and Trace Solutions Market Revenue (US$ Million), 2020-2030

Figure 4. Asia Pacific Track and Trace Solutions Market Share (%) - by Component (2022 and 2030)

Figure 5. Software: Asia Pacific Track and Trace Solutions Market - Revenue and Forecast to 2030 (US$ Million)

Figure 6. Hardware: Asia Pacific Track and Trace Solutions Market - Revenue and Forecast to 2030 (US$ Million)

Figure 7. Asia Pacific Track and Trace Solutions Market Share (%) - by Application (2022 and 2030)

Figure 8. Serialization Solution: Asia Pacific Track and Trace Solutions Market - Revenue and Forecast to 2030 (US$ Million)

Figure 9. Aggregation Solution: Asia Pacific Track and Trace Solutions Market - Revenue and Forecast to 2030 (US$ Million)

Figure 10. Asia Pacific Track and Trace Solutions Market Share (%) - by Enterprises Size (2022 and 2030)

Figure 11. SMEs: Asia Pacific Track and Trace Solutions Market - Revenue and Forecast to 2030 (US$ Million)

Figure 12. Large Enterprises: Asia Pacific Track and Trace Solutions Market - Revenue and Forecast to 2030 (US$ Million)

Figure 13. Asia Pacific Track and Trace Solutions Market Share (%) - by End Users (2022 and 2030)

Figure 14. Pharmaceutical: Asia Pacific Track and Trace Solutions Market - Revenue and Forecast to 2030 (US$ Million)

Figure 15. Medical Devices: Asia Pacific Track and Trace Solutions Market - Revenue and Forecast to 2030 (US$ Million)

Figure 16. Consumer Goods: Asia Pacific Track and Trace Solutions Market - Revenue and Forecast to 2030 (US$ Million)

Figure 17. Food and Beverages: Asia Pacific Track and Trace Solutions Market - Revenue and Forecast to 2030 (US$ Million)

Figure 18. Others: Asia Pacific Track and Trace Solutions Market - Revenue and Forecast to 2030 (US$ Million)

Figure 19. Asia Pacific: Track and Trace Solutions Market Revenue, by Key Countries, (2022) (US$ Mn)

Figure 20. Asia Pacific: Track and Trace Solutions Market Breakdown, by Key Countries, 2022 and 2030 (%)

Figure 21. China: Track and Trace Solutions Market - Revenue and Forecast to 2030(US$ Million)

Figure 22. Japan: Track and Trace Solutions Market - Revenue and Forecast to 2030(US$ Million)

Figure 23. India: Track and Trace Solutions Market - Revenue and Forecast to 2030(US$ Million)

Figure 24. South Korea: Track and Trace Solutions Market - Revenue and Forecast to 2030(US$ Million)

Figure 25. Australia: Track and Trace Solutions Market - Revenue and Forecast to 2030(US$ Million)

Figure 26. Rest of Asia Pacific: Track and Trace Solutions Market - Revenue and Forecast to 2030(US$ Million)

Figure 27. Growth Strategies Done by the Companies in the Market, (%)

1. SAP SE 
2. Uhlmann Pac-Systeme GmbH & Co KG 
3. WIPOTEC GmbH 
4. Bar Code India Ltd 
5. Korber AG 
6. Videojet Technologies Inc 
7. Domino Printing Sciences plc 
8. Kezzler AS 
9. rfxcel Corp 
10. NeuroTags Inc 
11. Jekson Vison Pvt Ltd 

  • Save and reduce time carrying out entry-level research by identifying the growth, size, leading players, and segments in the Asia Pacific track and trace solutions market.
  • Highlights key business priorities in order to assist companies to realign their business strategies.
  • The key findings and recommendations highlight crucial progressive industry trends in the Asia Pacific track and trace solutions market, thereby allowing players across the value chain to develop effective long-term strategies.
  • Develop/modify business expansion plans by using substantial growth offering developed and emerging markets.
  • Scrutinize in-depth Asia Pacific market trends and outlook coupled with the factors driving the Asia Pacific track and trace solutions market, as well as those hindering it.
  • Enhance the decision-making process by understanding the strategies that underpin commercial interest with respect to client products, segmentation, pricing, and distribution.
Report Code
Full Name
Country Name
Email Id
Phone Number
Job Title
Company
Requirement

Note : Your data will never be shared with third parties, however, we may send you information from time to time about our products that may be of interest to you. By submitting your details, you agree to be contacted by us. You may contact us at any time to opt-out.


Purchase Options
Single User License
$3550
$2485
Site License
$4550
$3185
Enterprise License
$5550
$3885