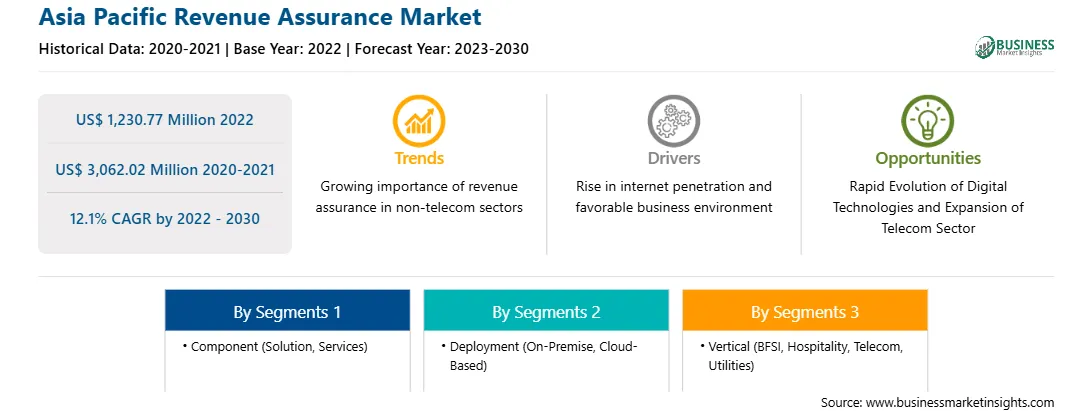
アジア太平洋地域の収益保証市場予測 - 2030 年まで - 地域分析 - コンポーネント (ソリューションとサービス)、展開 (オンプレミスとクラウドベース)、組織規模 (中小企業と大企業)、業種 (BFSI、ホスピタリティ、通信、公益事業、その他) 別
デジタル技術の急速な進化がアジア太平洋地域の収益保証市場を後押し
技術の進歩はさまざまな業界に革命をもたらしましたが、収益保証市場も例外ではありません。機械学習や人工知能などのデジタル技術の急速な進化により、収益保証市場には、その有効性を高め、ビジネスの成長を促進する新たな機会がもたらされています。収益保証において技術は極めて重要であり、収益源を監視、分析、最適化するための革新的なツールとソリューションを提供します。これにより、企業はプロセスを合理化し、収益漏洩を特定し、規制基準への準拠を確保できます。収益保証に技術の進歩を取り入れることで、業務効率の向上、収益創出の増加、顧客満足度の向上につながります。
予測分析では、過去のデータとリアルタイムのデータを活用して、将来の収益パターンを予測し、潜在的な収益漏洩を特定し、リスクを軽減します。収益保証チームは、高度なアルゴリズムと機械学習技術を採用することで、収益の傾向を予測し、収益損失の可能性のある領域を特定し、問題が発生する前に予防策を実施できます。このプロアクティブなアプローチは、企業が収益源を最適化し、財務リスクを最小限に抑えるのに役立ちます。さらに、ブロックチェーン技術は、収益保証のための透明で安全なプラットフォームを提供します。ブロックチェーンの分散型台帳システムを活用することで、企業は収益関連データの整合性と不変性を確保できます。この技術により、取引の安全で改ざん防止された記録が可能になり、収益調整プロセスが簡素化され、利害関係者の信頼が高まります。ブロックチェーンは決済プロセスを迅速化し、支払いの遅れや紛争による収益漏洩を減らします。
特にビッグデータと機械学習 (ML) における技術の進歩は、収益保証市場に革命をもたらしています。これらの進歩により、企業は収益源を効果的に管理および最適化できるようになり、収益性と運用効率が向上します。ビッグデータ分析により、組織は顧客取引、課金システム、ネットワーク運用など、さまざまなソースから膨大な量のデータを収集して分析できます。高度な分析手法を使用することで、企業は収益創出プロセスに関する貴重な洞察を得て、潜在的な収益漏洩を特定し、積極的に対処することができます。この積極的なアプローチは、財務上の損失を最小限に抑え、正確な請求と収益認識を保証するのに役立ちます。
機械学習 (ML) は、複雑なデータ分析タスクを自動化し、収益パターンの異常や逸脱を検出することで、収益保証において重要な役割を果たします。ML アルゴリズムは、履歴データを分析し、傾向を特定し、潜在的な収益リスクを予測できます。これにより、企業は予防措置を講じ、収益損失を軽減するための積極的な戦略を実施できます。このため、さまざまな国やグローバル プレーヤーが、ワークフローに AI テクノロジーを組み込むことに重点を置いています。さまざまな国が、2030年までに最高の人工知能(AI)ハブになることを目指しています。さらに、国際貿易局のレポートによると、AIの世界的な資金調達は、2020年と比較して2021年に668億米ドルに倍増しました。これは、AIが世界中のビジネス環境にもたらす計り知れない可能性と機会を意味し、AI主導のイノベーションと開発により、いくつかの業界で成長していることを浮き彫りにしています。
アジア太平洋地域の収益保証市場の概要
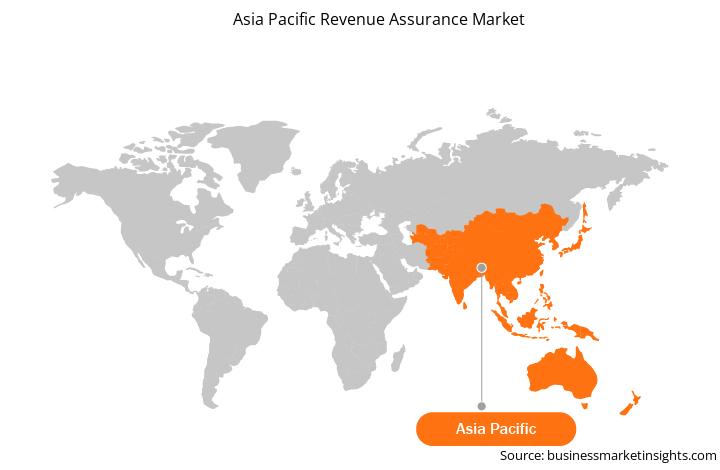
アジア太平洋地域市場は、オーストラリア、日本、中国、韓国、インド、その他のアジア太平洋地域に分かれています。収益保証市場では大幅な成長を遂げています。この地域の急速に成長する経済により、通信サービスと金融商品の需要が急増しています。この複雑さにより、収益漏洩を防ぎ、財務の完全性を維持するための堅牢な収益保証ソリューションが必要になります。さらに、デジタルの需要と習慣を満たすために、消費者はeコマース、デジタル金融サービス、ビデオ会議などのデジタルサービスの利用を増やしています。企業はまた、リモートワーカーをサポートするためにビッグデータ、クラウドコンピューティング、セキュリティなどのICTソリューションを購入しています。デジタル時代では、個人が連絡を取り合うためにも、企業が活動を続けるためにも、接続性が不可欠です。
GSMAのモバイルエコノミーアジア太平洋2023レポートによると、2023年7月、アジア太平洋地域の通信事業者は2023年から2030年の間にネットワークに2,590億米ドルを投資すると推定されており、そのほとんどは5Gの展開に投資されます。さらに、5Gテクノロジー、クラウドベースのサービス、デジタルトランザクション、複雑な金融商品の採用が拡大するにつれて、正確な請求とコンプライアンスを確保するための高度な収益保証ツールの必要性が高まっています。さらに、業界を問わず、企業は財務の健全性を保護し、正確な請求を確保するために堅牢な収益保証ソリューションに投資することの価値をますます認識しています。このように、急速なデジタル化、厳格な規制、収益漏洩リスクに対する意識の高まりに後押しされ、アジア太平洋地域の収益保証市場は力強い成長を遂げる態勢が整っています。
アジア太平洋地域の収益保証市場の収益と2030年までの予測(百万米ドル)
アジア太平洋地域の収益保証市場のセグメンテーション
アジア太平洋地域の収益保証市場は、コンポーネント、展開、組織規模、垂直、および国に分類されています。
コンポーネントに基づいて、アジア太平洋地域の収益保証市場はソリューションとサービスに分かれています。ソリューションセグメントは2022年に大きな市場シェアを占めました。
展開に基づいて、アジア太平洋地域の収益保証市場はオンプレミスとクラウドベースに分かれています。クラウドベースセグメントは2022年に大きな市場シェアを占めました。
組織規模に基づいて、アジア太平洋地域の収益保証市場は中小企業と大企業に分かれています。大企業セグメントは2022年に大きな市場シェアを占めました。
垂直に基づいて、アジア太平洋地域の収益保証市場は、BFSI、ホスピタリティ、通信、公共事業などに分類されます。通信セグメントは2022年に最大の市場シェアを占めました。
国別に見ると、アジア太平洋地域の収益保証市場は、オーストラリア、中国、インド、日本、韓国、ニュージーランド、その他のアジア太平洋地域に分かれています。2022年には中国がアジア太平洋地域の収益保証市場シェアを独占しました。
Nokia Corp、Tata Consultancy Services Ltd、Amdocs、Subex、Araxxe SAS、Panamax Inc、Adapt IT Holding Proprietary Ltd、Latro Services Incは、アジア太平洋地域の収益保証市場で事業を展開している大手企業の一部です。
TABLE OF CONTENTS
1. Introductions
1.1 The Insight Partners Research Report Guidance
1.2 Market Segmentation
2. Executive Summary
2.1 Key Insights
2.2 Market Attractiveness
3. Research Methodology
3.1 Coverage
3.2 Secondary Research
3.3 Primary Research
4. Revenue Assurance Market Landscape
4.1 Overview
4.2 PEST Analysis
4.3 Ecosystem Analysis
4.3.1 Solution Providers:
4.3.2 Service Providers
4.3.3 End Users:
4.3.4 List of Vendors in the Value Chain
5. Asia Pacific Revenue Assurance Market - Key Market Dynamics
5.1 Drivers
5.1.1 Rise in Internet Penetration
5.1.2 Favorable Business Environment
5.2 Restraints
5.2.1 Lack of Awareness and Understanding of Revenue Assurance
5.2.2 Organizational Management Issues
5.3 Opportunity
5.3.1 Rapid Evolution of Digital Technologies
5.3.2 Expansion of Telecom Sector
5.4 Future Trends
5.4.1 Growing Importance of Revenue Assurance in Non-Telecom Sectors
5.5 Impact of Drivers and Restraints:
6. Revenue Assurance Market - Asia Pacific Market Analysis
6.1 Revenue Assurance Market Revenue (US$ Million), 2020-2030
6.2 Revenue Assurance Market Forecast Analysis
7. Asia Pacific Revenue Assurance Market Analysis - by Component
7.1 Solution
7.1.1 Overview
7.1.2 Solution: Revenue Assurance Market - Revenue and Forecast to 2030 (US$ Million)
7.2 Services
7.2.1 Overview
7.2.2 Services: Revenue Assurance Market - Revenue and Forecast to 2030 (US$ Million)
8. Asia Pacific Revenue Assurance Market Analysis - by Deployment
8.1 On-premise
8.1.1 Overview
8.1.2 On-premise: Revenue Assurance Market - Revenue and Forecast to 2030 (US$ Million)
8.2 Cloud-based
8.2.1 Overview
8.2.2 Cloud-based: Revenue Assurance Market - Revenue and Forecast to 2030 (US$ Million)
9. Asia Pacific Revenue Assurance Market Analysis - by Organization Size
9.1 SMEs
9.1.1 Overview
9.1.2 SMEs: Revenue Assurance Market - Revenue and Forecast to 2030 (US$ Million)
9.2 Large Enterprises
9.2.1 Overview
9.2.2 Large Enterprises: Revenue Assurance Market - Revenue and Forecast to 2030 (US$ Million)
10. Asia Pacific Revenue Assurance Market Analysis - by Vertical
10.1 BFSI
10.1.1 Overview
10.1.2 BFSI: Revenue Assurance Market - Revenue and Forecast to 2030 (US$ Million)
10.2 Hospitality
10.2.1 Overview
10.2.2 Hospitality: Revenue Assurance Market - Revenue and Forecast to 2030 (US$ Million)
10.3 Telecom
10.3.1 Overview
10.3.2 Telecom: Revenue Assurance Market - Revenue and Forecast to 2030 (US$ Million)
10.4 Utilities
10.4.1 Overview
10.4.2 Utilities: Revenue Assurance Market - Revenue and Forecast to 2030 (US$ Million)
10.5 Others
10.5.1 Overview
10.5.2 Others: Revenue Assurance Market - Revenue and Forecast to 2030 (US$ Million)
11. Asia Pacific Revenue Assurance Market - Country Analysis
11.1 Asia Pacific Market Overview
11.1.1 Asia Pacific: Revenue Assurance Market - Revenue and Forecast Analysis - by Country
11.1.1.1 Asia Pacific: Revenue Assurance Market - Revenue and Forecast Analysis - by Country
11.1.1.2 China: Revenue Assurance Market - Revenue and Forecast to 2030 (US$ Million)
11.1.1.2.1 China: Revenue Assurance Market Breakdown, by Component
11.1.1.2.2 China: Revenue Assurance Market Breakdown, by Deployment
11.1.1.2.3 China: Revenue Assurance Market Breakdown, by Organization Size
11.1.1.2.4 China: Revenue Assurance Market Breakdown, by Vertical
11.1.1.3 Japan: Revenue Assurance Market - Revenue and Forecast to 2030 (US$ Million)
11.1.1.3.1 Japan: Revenue Assurance Market Breakdown, by Component
11.1.1.3.2 Japan: Revenue Assurance Market Breakdown, by Deployment
11.1.1.3.3 Japan: Revenue Assurance Market Breakdown, by Organization Size
11.1.1.3.4 Japan: Revenue Assurance Market Breakdown, by Vertical
11.1.1.4 South Korea: Revenue Assurance Market - Revenue and Forecast to 2030 (US$ Million)
11.1.1.4.1 South Korea: Revenue Assurance Market Breakdown, by Component
11.1.1.4.2 South Korea: Revenue Assurance Market Breakdown, by Deployment
11.1.1.4.3 South Korea: Revenue Assurance Market Breakdown, by Organization Size
11.1.1.4.4 South Korea: Revenue Assurance Market Breakdown, by Vertical
11.1.1.5 India: Revenue Assurance Market - Revenue and Forecast to 2030 (US$ Million)
11.1.1.5.1 India: Revenue Assurance Market Breakdown, by Component
11.1.1.5.2 India: Revenue Assurance Market Breakdown, by Deployment
11.1.1.5.3 India: Revenue Assurance Market Breakdown, by Organization Size
11.1.1.5.4 India: Revenue Assurance Market Breakdown, by Vertical
11.1.1.6 Australia: Revenue Assurance Market - Revenue and Forecast to 2030 (US$ Million)
11.1.1.6.1 Australia: Revenue Assurance Market Breakdown, by Component
11.1.1.6.2 Australia: Revenue Assurance Market Breakdown, by Deployment
11.1.1.6.3 Australia: Revenue Assurance Market Breakdown, by Organization Size
11.1.1.6.4 Australia: Revenue Assurance Market Breakdown, by Vertical
11.1.1.7 Rest of Asia Pacific: Revenue Assurance Market - Revenue and Forecast to 2030 (US$ Million)
11.1.1.7.1 Rest of Asia Pacific: Revenue Assurance Market Breakdown, by Component
11.1.1.7.2 Rest of Asia Pacific: Revenue Assurance Market Breakdown, by Deployment
11.1.1.7.3 Rest of Asia Pacific: Revenue Assurance Market Breakdown, by Organization Size
11.1.1.7.4 Rest of Asia Pacific: Revenue Assurance Market Breakdown, by Vertical
12. Competitive Landscape
12.1 Heat Map Analysis by Key Players
12.2 Company Positioning & Concentration
13. Industry Landscape
13.1 Overview
13.2 Market Initiative
13.3 Mergers & Acquisitions
14. Company Profiles
14.1 Nokia Corp
14.1.1 Key Facts
14.1.2 Business Description
14.1.3 Products and Services
14.1.4 Financial Overview
14.1.5 SWOT Analysis
14.1.6 Key Developments
14.2 Tata Consultancy Services Ltd
14.2.1 Key Facts
14.2.2 Business Description
14.2.3 Products and Services
14.2.4 Financial Overview
14.2.5 SWOT Analysis
14.2.6 Key Developments
14.3 Amdocs Ltd
14.3.1 Key Facts
14.3.2 Business Description
14.3.3 Products and Services
14.3.4 Financial Overview
14.3.5 SWOT Analysis
14.3.6 Key Developments
14.4 Subex Ltd
14.4.1 Key Facts
14.4.2 Business Description
14.4.3 Products and Services
14.4.4 Financial Overview
14.4.5 SWOT Analysis
14.4.6 Key Developments
14.5 Araxxe SAS
14.5.1 Key Facts
14.5.2 Business Description
14.5.3 Products and Services
14.5.4 Financial Overview
14.5.5 SWOT Analysis
14.5.6 Key Developments
14.6 Panamax Inc
14.6.1 Key Facts
14.6.2 Business Description
14.6.3 Products and Services
14.6.4 Financial Overview
14.6.5 SWOT Analysis
14.6.6 Key Developments
14.7 Adapt IT Holdings Proprietary Ltd
14.7.1 Key Facts
14.7.2 Business Description
14.7.3 Products and Services
14.7.4 Financial Overview
14.7.5 SWOT Analysis
14.7.6 Key Developments
14.8 LATRO Services Inc
14.8.1 Key Facts
14.8.2 Business Description
14.8.3 Products and Services
14.8.4 Financial Overview
14.8.5 SWOT Analysis
14.8.6 Key Developments
15. Appendix
15.1 About The Insight Partners
15.2 Word Index
List of Tables
Table 1. Revenue Assurance Market Segmentation
Table 2. List of Vendors
Table 3. Revenue Assurance Market - Revenue and Forecast to 2030 (US$ Million)
Table 4. Revenue Assurance Market - Revenue and Forecast to 2030 (US$ Million) - by Component
Table 5. Revenue Assurance Market - Revenue and Forecast to 2030 (US$ Million) - by Deployment
Table 6. Revenue Assurance Market - Revenue and Forecast to 2030 (US$ Million) - by Organization Size
Table 7. Revenue Assurance Market - Revenue and Forecast to 2030 (US$ Million) - by Vertical
Table 8. Asia Pacific: Revenue Assurance Market - Revenue and Forecast to 2030 (US$ Million) - by Country
Table 9. China: Revenue Assurance Market - Revenue and Forecast to 2030 (US$ Million) - by Component
Table 10. China: Revenue Assurance Market - Revenue and Forecast to 2030 (US$ Million) - by Deployment
Table 11. China: Revenue Assurance Market - Revenue and Forecast to 2030 (US$ Million) - by Organization Size
Table 12. China: Revenue Assurance Market - Revenue and Forecast to 2030 (US$ Million) - by Vertical
Table 13. Japan: Revenue Assurance Market - Revenue and Forecast to 2030 (US$ Million) - by Component
Table 14. Japan: Revenue Assurance Market - Revenue and Forecast to 2030 (US$ Million) - by Deployment
Table 15. Japan: Revenue Assurance Market - Revenue and Forecast to 2030 (US$ Million) - by Organization Size
Table 16. Japan: Revenue Assurance Market - Revenue and Forecast to 2030 (US$ Million) - by Vertical
Table 17. South Korea: Revenue Assurance Market - Revenue and Forecast to 2030 (US$ Million) - by Component
Table 18. South Korea: Revenue Assurance Market - Revenue and Forecast to 2030 (US$ Million) - by Deployment
Table 19. South Korea: Revenue Assurance Market - Revenue and Forecast to 2030 (US$ Million) - by Organization Size
Table 20. South Korea: Revenue Assurance Market - Revenue and Forecast to 2030 (US$ Million) - by Vertical
Table 21. India: Revenue Assurance Market - Revenue and Forecast to 2030 (US$ Million) - by Component
Table 22. India: Revenue Assurance Market - Revenue and Forecast to 2030 (US$ Million) - by Deployment
Table 23. India: Revenue Assurance Market - Revenue and Forecast to 2030 (US$ Million) - by Organization Size
Table 24. India: Revenue Assurance Market - Revenue and Forecast to 2030 (US$ Million) - by Vertical
Table 25. Australia: Revenue Assurance Market - Revenue and Forecast to 2030 (US$ Million) - by Component
Table 26. Australia: Revenue Assurance Market - Revenue and Forecast to 2030 (US$ Million) - by Deployment
Table 27. Australia: Revenue Assurance Market - Revenue and Forecast to 2030 (US$ Million) - by Organization Size
Table 28. Australia: Revenue Assurance Market - Revenue and Forecast to 2030 (US$ Million) - by Vertical
Table 29. Rest of Asia Pacific: Revenue Assurance Market - Revenue and Forecast to 2030 (US$ Million) - by Component
Table 30. Rest of Asia Pacific: Revenue Assurance Market - Revenue and Forecast to 2030 (US$ Million) - by Deployment
Table 31. Rest of Asia Pacific: Revenue Assurance Market - Revenue and Forecast to 2030 (US$ Million) - by Organization Size
Table 32. Rest of Asia Pacific: Revenue Assurance Market - Revenue and Forecast to 2030 (US$ Million) - by Vertical
Table 33. Heat Map Analysis
Table 34. List of Abbreviation
List of Figures
Figure 1. Revenue Assurance Market Segmentation, by Country
Figure 2. PEST Analysis
Figure 3. Ecosystem Analysis
Figure 4. Revenue Assurance Market - Key Market Dynamics
Figure 5. Impact Analysis of Drivers and Restraints
Figure 6. Revenue Assurance Market Revenue (US$ Million), 2020-2030
Figure 7. Revenue Assurance Market Share (%) - by Component (2022 and 2030)
Figure 8. Solution: Revenue Assurance Market - Revenue and Forecast to 2030 (US$ Million)
Figure 9. Services: Revenue Assurance Market - Revenue and Forecast to 2030 (US$ Million)
Figure 10. Revenue Assurance Market Share (%) - by Deployment (2022 and 2030)
Figure 11. On-premise: Revenue Assurance Market - Revenue and Forecast to 2030 (US$ Million)
Figure 12. Cloud-based: Revenue Assurance Market - Revenue and Forecast to 2030 (US$ Million)
Figure 13. Revenue Assurance Market Share (%) - by Organization Size (2022 and 2030)
Figure 14. SMEs: Revenue Assurance Market - Revenue and Forecast to 2030 (US$ Million)
Figure 15. Large Enterprises: Revenue Assurance Market - Revenue and Forecast to 2030 (US$ Million)
Figure 16. Revenue Assurance Market Share (%) - by Vertical (2022 and 2030)
Figure 17. BFSI: Revenue Assurance Market - Revenue and Forecast to 2030 (US$ Million)
Figure 18. Hospitality: Revenue Assurance Market - Revenue and Forecast to 2030 (US$ Million)
Figure 19. Telecom: Revenue Assurance Market - Revenue and Forecast to 2030 (US$ Million)
Figure 20. Utilities: Revenue Assurance Market - Revenue and Forecast to 2030 (US$ Million)
Figure 21. Others: Revenue Assurance Market - Revenue and Forecast to 2030 (US$ Million)
Figure 22. Asia Pacific: Revenue Assurance Market, by Key Country - Revenue (2022) (US$ Million)
Figure 23. Asia Pacific: Revenue Assurance Market Breakdown, by Key Countries, 2022 and 2030 (%)
Figure 24. China: Revenue Assurance Market - Revenue and Forecast to 2030 (US$ Million)
Figure 25. Japan: Revenue Assurance Market - Revenue and Forecast to 2030 (US$ Million)
Figure 26. South Korea: Revenue Assurance Market - Revenue and Forecast to 2030 (US$ Million)
Figure 27. India: Revenue Assurance Market - Revenue and Forecast to 2030 (US$ Million)
Figure 28. Australia: Revenue Assurance Market - Revenue and Forecast to 2030 (US$ Million)
Figure 29. Rest of Asia Pacific: Revenue Assurance Market - Revenue and Forecast to 2030 (US$ Million)
Figure 30. Company Positioning & Concentration
1. Nokia Corp
2. Tata Consultancy Services Ltd
3. Amdocs
4. Subex Ltd
5. Araxxe SAS
6. Panamax Inc
7. Adapt IT Holdings Proprietary Ltd
8. LATRO Services Inc
- Save and reduce time carrying out entry-level research by identifying the growth, size, leading players, and segments in the Asia Pacific revenue assurance market.
- Highlights key business priorities in order to assist companies to realign their business strategies.
- The key findings and recommendations highlight crucial progressive industry trends in the Asia Pacific revenue assurance market, thereby allowing players across the value chain to develop effective long-term strategies.
- Develop/modify business expansion plans by using substantial growth offering developed and emerging markets.
- Scrutinize in-depth Asia Pacific market trends and outlook coupled with the factors driving the Asia Pacific revenue assurance market, as well as those hindering it.
- Enhance the decision-making process by understanding the strategies that underpin commercial interest with respect to client products, segmentation, pricing, and distribution.