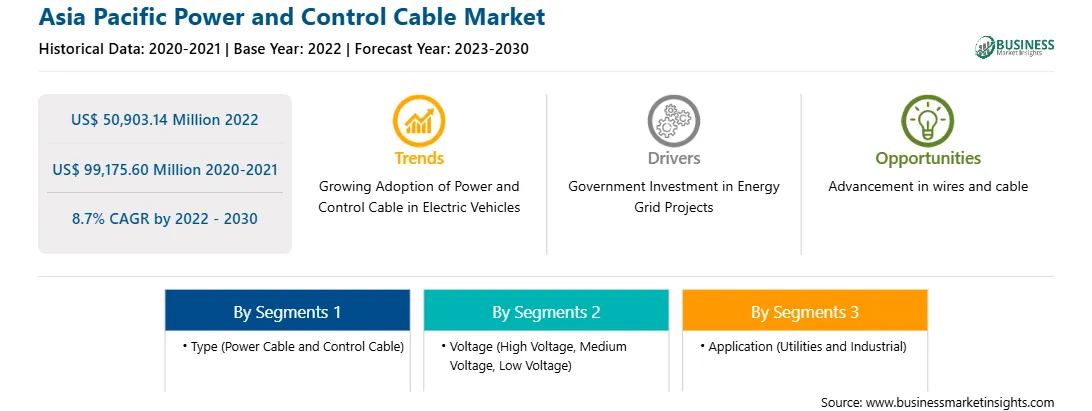
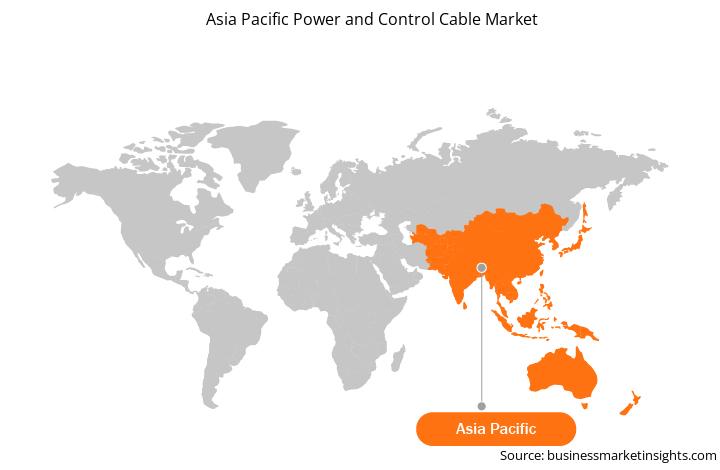
2030年までのアジア太平洋電力および制御ケーブル市場予測 - 地域分析 - タイプ別(電力ケーブルおよび制御ケーブル)、電圧(高電圧、中電圧、および低電圧)、およびアプリケーション(公益事業および産業用)別
送配電部門の発展に関する政府規範がアジア太平洋地域の電力および制御ケーブル市場を促進
世界のいくつかの政府送配電部門の発展に関する取り組みを行っています。たとえば、2023 年には、8 つの重要な送電システムと再生可能エネルギーゾーンプロジェクトを支援するための 53 億米ドルの協力協定がオーストラリアの連邦政府と州政府によって発表されました。この投資は、国の電力網とインフラの近代化に110億米ドルを費やすことに焦点を当てた国の再配線政策の一環であった。また、インドは2022年に、再生可能エネルギーの撤退のための州間送電網(ISTS)の確立に2026~2027年までに171億米ドルを支出し、2030年までにさらに28億米ドルを支出する計画を発表した。電力および制御ケーブル市場の成長を促進します。
アジア太平洋電力および制御ケーブル市場の概要
IEA のデータによると、APAC は最大の電力生産者および消費者です。この地域には、世界最大の製造拠点や工業用地がいくつかあります。中国やインドなどの国は世界で最も人口の多い 2 か国であるため、小国に比べてかなり多くの電力を消費します。中国の発電能力は、過去 20 年間にわたって同国の産業および全体的な成長を支えてきました。電力消費量は2000年から2021年の間に6倍以上に増加し、同国の発電能力は世界最大となり、世界の発電量の約3分の1に貢献している。中国は2021年に33ギガワットの石炭火力発電の建設を開始し、2022年には8.63ギガワットの追加石炭火力発電所を承認した。しかし、中国のゼロコロナ政策は2022年の経済活動に重くのしかかり、電力需要の伸びペースを巡る不確実性は依然として残っている。 IEAは、2022年の電力需要は2.6%増加すると推定しており、2015年から2019年のパンデミック前の平均である5%強を大幅に下回っている。こうした要因が電力ケーブルの需要を妨げる一方、産業部門の持続的な成長が国の電力増加に貢献した。そして制御ケーブル市場。
インドでは、送電システムが長年にわたって拡張され、州内および州間の送電システムを通じて発電所から負荷センターまで電力を配電してきました。送電システムは配電システムと発電所を結び付けるため、消費者への電力供給において重要な役割を果たします。 2023 年 4 月、インド政府は 4,25,500 周回キロメートル (ckm) (2020 年 5 月 31 日時点) を 2024 年から 2025 年までに 4,54,200 ckm に拡大する計画を発表しました。ガティ・シャクティ・マスタープラン。この追加は、州間送電システム (ISTS) ネットワークおよび 220kV 以上の電圧レベルに対して提案されました。同様に、2023 年 2 月、国営パワーグリッド公社は、料金ベースの競争入札ルートを通じて 5 つの州間送電プロジェクトを受注しました。これらのプロジェクトは、建設、所有、運営、移管 (BOOT) ベースで完了します。 2022年12月、同国は送電線の建設と再生可能エネルギーの接続に296億ドル相当の計画を発表し、2030年までに再生可能エネルギー容量を3倍にすることを目指している。こうしたすべての要因が国内のさまざまな電力ケーブルや制御ケーブルの需要を押し上げると予想される。予測期間中。
日本と韓国は自動車製造の主要国です。自動車製造は日本の製造業の89%を占めています。さらに、両国はEVの導入を急速に進めており、関連産業やインフラの成長につながっている。例えば、日本の経済産業省は2022年8月、電気自動車(EV)やエネルギーに使用できる競争力のある電池の製造拠点を開発するには240億米ドル以上の投資が必要と見積もった。ストレージシステム。韓国ではEVの普及を促進するため、政府が国民にEV購入の補助金を支給している。 2023年2月、政府は補助金対象のEVの台数を2022年の16万台から2023年には21万5千台に34%増やす計画を発表した。さらに、環境産業省の統計によると、電気自動車補助金は全額補助される予定だ。韓国での価格が 46,462 米ドル未満の車両。 EVの需要の高まりにより、両国で充電インフラの整備が促進され、電力ケーブルの必要性が高まっています。このように、自動車分野の拡大により、電源および制御ケーブルの需要が高まっています。
アジア太平洋の電力および制御ケーブル市場の収益と 2030 年までの予測 (百万米ドル)
アジア太平洋の電力および制御ケーブル市場のセグメント化
アジア太平洋の電力および制御ケーブル市場はタイプ、電圧、アプリケーション、国に基づいて分割されます。
アジア太平洋地域の電力および制御ケーブル市場は、タイプに基づいて電力ケーブルと制御ケーブルに二分されます。 2022 年には電力ケーブル部門がより大きなシェアを占めました。
アジア太平洋地域の電力および制御ケーブル市場は、電圧別に高電圧、中電圧、低電圧に分類されます。低電圧セグメントが 2022 年に最大のシェアを占めました。
アジア太平洋地域の電力および制御ケーブル市場は、用途別に公益事業と産業に分類されます。 2022 年には公益事業セグメントがより大きなシェアを占めました。
アジア太平洋電力および制御ケーブル市場は国別に、中国、日本、インド、韓国、オーストラリア、およびその他のアジア太平洋地域に分割されています。 2022 年、中国はアジア太平洋地域の電力および制御ケーブル市場を独占しました。
Belden Inc;古河電気工業株式会社、恒通グループ株式会社; LEONI AG、Nexans SA;プリズミアンSpA;住友電気工業株式会社および住友電気工業株式会社は、アジア太平洋地域の電力および制御ケーブル市場で事業を展開する大手企業の一部です。
Table of Content
1. Introduction
1.1 The Insight Partners Research Report Guidance
1.2 Market Segmentation
2. Executive Summary
2.1 Key Insights
2.2 Market Attractiveness
3. Research Methodology
3.1 Coverage
3.2 Secondary Research
3.3 Primary Research
4. Asia Pacific Power and Control Market Landscape
4.1 Overview
4.2 Asia Pacific PEST Analysis
4.3 Ecosystem Analysis
4.3.1 Raw Material Providers:
4.3.2 Power and Control Cable Manufacturers:
4.3.3 Distributors:
4.3.4 End-Users:
4.3.5 Regulatory Bodies:
4.3.6 List of Vendors in the Value Chain:
5. Asia Pacific Power and Control Market - Key Industry Dynamics
5.1 Asia Pacific Power and Control Market - Key Industry Dynamics
5.2 Market Drivers
5.2.1 Rising Demand for Reliable Electricity
5.2.2 Government Norms on Developing Transmission & Distribution Sector
5.3 Market Restraints
5.3.1 Availability of Alternative Technologies
5.4 Market Opportunities
5.4.1 Increasing Demand for Data Center and Cloud Computing
5.4.2 Technological Advancements in Wires and Cables
5.5 Future Trends
5.5.1 Expansion of Smart Grid
5.6 Impact of Drivers and Restraints:
6. Power and Control Market - Asia Pacific Market Analysis
6.1 Asia Pacific Power and Control Market Revenue (US$ Million), 2022 - 2030
6.2 Asia Pacific Power and Control Market Forecast and Analysis
7. Asia Pacific Power and Control Market Analysis - Type
7.1 Power Cable
7.1.1 Overview
7.1.2 Power Cable Market Revenue, and Forecast to 2030 (US$ Million)
7.2 Control Cable
7.2.1 Overview
7.2.2 Control Cable Market Revenue, and Forecast to 2030 (US$ Million)
8. Asia Pacific Power and Control Market Analysis - Voltage
8.1 Low Voltage
8.1.1 Overview
8.1.2 Low Voltage Market Revenue, and Forecast to 2030 (US$ Million)
8.2 Medium Voltage
8.2.1 Overview
8.2.2 Medium Voltage Market Revenue, and Forecast to 2030 (US$ Million)
8.3 High Voltage
8.3.1 Overview
8.3.2 High Voltage Market Revenue, and Forecast to 2030 (US$ Million)
9. Asia Pacific Power and Control Market Analysis - Application
9.1 Utilities
9.1.1 Overview
9.1.2 Utilities Market Revenue, and Forecast to 2030 (US$ Million)
9.2 Industrial
9.2.1 Overview
9.2.2 Industrial Market Revenue, and Forecast to 2030 (US$ Million)
10. Asia Pacific Power and Control Market - Geographical Analysis
10.1 Overview
10.1.1 Asia Pacific: Asia Pacific Power and Control Market, by Key Country
10.1.1.1 Australia: Asia Pacific Power and Control Market - Revenue, and Forecast to 2030 (US$ Million)
10.1.1.1.1 Australia: Asia Pacific Power and Control Market, by Type
10.1.1.1.2 Australia: Asia Pacific Power and Control Market, by Voltage
10.1.1.1.3 Australia: Asia Pacific Power and Control Market, by Application
10.1.1.2 China: Asia Pacific Power and Control Market - Revenue, and Forecast to 2030 (US$ Million)
10.1.1.2.1 China: Asia Pacific Power and Control Market, by Type
10.1.1.2.2 China: Asia Pacific Power and Control Market, by Voltage
10.1.1.2.3 China: Asia Pacific Power and Control Market, by Application
10.1.1.3 India: Asia Pacific Power and Control Market - Revenue, and Forecast to 2030 (US$ Million)
10.1.1.3.1 India: Asia Pacific Power and Control Market, by Type
10.1.1.3.2 India: Asia Pacific Power and Control Market, by Voltage
10.1.1.3.3 India: Asia Pacific Power and Control Market, by Application
10.1.1.4 Japan: Asia Pacific Power and Control Market - Revenue, and Forecast to 2030 (US$ Million)
10.1.1.4.1 Japan: Asia Pacific Power and Control Market, by Type
10.1.1.4.2 Japan: Asia Pacific Power and Control Market, by Voltage
10.1.1.4.3 Japan: Asia Pacific Power and Control Market, by Application
10.1.1.5 South Korea: Asia Pacific Power and Control Market - Revenue, and Forecast to 2030 (US$ Million)
10.1.1.5.1 South Korea: Asia Pacific Power and Control Market, by Type
10.1.1.5.2 South Korea: Asia Pacific Power and Control Market, by Voltage
10.1.1.5.3 South Korea: Asia Pacific Power and Control Market, by Application
10.1.1.6 Rest of Asia Pacific: Asia Pacific Power and Control Market - Revenue, and Forecast to 2030 (US$ Million)
10.1.1.6.1 Rest of Asia Pacific: Asia Pacific Power and Control Market, by Type
10.1.1.6.2 Rest of Asia Pacific: Asia Pacific Power and Control Market, by Voltage
10.1.1.6.3 Rest of Asia Pacific: Asia Pacific Power and Control Market, by Application
11. Competitive Landscape
11.1 Heat Map Analysis By Key Players
11.2 Company Positioning & Concentration
12. Industry Landscape
12.1 Overview
12.2 Market Initiative
13. Company Profiles
13.1 Belden Inc
13.1.1 Key Facts
13.1.2 Business Description
13.1.3 Products and Services
13.1.4 Financial Overview
13.1.5 SWOT Analysis
13.1.6 Key Developments
13.2 Furukawa Electric Co Ltd
13.2.1 Key Facts
13.2.2 Business Description
13.2.3 Products and Services
13.2.4 Financial Overview
13.2.5 SWOT Analysis
13.2.6 Key Developments
13.3 HENGTONG GROUP CO.,LTD.
13.3.1 Key Facts
13.3.2 Business Description
13.3.3 Products and Services
13.3.4 Financial Overview
13.3.5 SWOT Analysis
13.3.6 Key Developments
13.4 LEONI AG
13.4.1 Key Facts
13.4.2 Business Description
13.4.3 Products and Services
13.4.4 Financial Overview
13.4.5 SWOT Analysis
13.4.6 Key Developments
13.5 Nexans SA
13.5.1 Key Facts
13.5.2 Business Description
13.5.3 Products and Services
13.5.4 Financial Overview
13.5.5 SWOT Analysis
13.5.6 Key Developments
13.6 Prysmian SpA
13.6.1 Key Facts
13.6.2 Business Description
13.6.3 Products and Services
13.6.4 Financial Overview
13.6.5 SWOT Analysis
13.6.6 Key Developments
13.7 Sumitomo Electric Industries Ltd
13.7.1 Key Facts
13.7.2 Business Description
13.7.3 Products and Services
13.7.4 Financial Overview
13.7.5 SWOT Analysis
13.7.6 Key Developments
14. Appendix
14.1 About The Insight Partners
14.2 Word Index
List of Tables
Table 1. Asia Pacific Power and Control Market Segmentation
Table 2. Asia Pacific Power and Control Market Revenue and Forecasts To 2030 (US$ Million)
Table 3. Asia Pacific Power and Control Market Revenue and Forecasts To 2030 (US$ Million) -Type
Table 4. Asia Pacific Power and Control Market Revenue and Forecasts To 2030 (US$ Million) - Voltage
Table 5. Asia Pacific Power and Control Market Revenue and Forecasts To 2030 (US$ Million) - Application
Table 6. Australia: Asia Pacific Power and Control Market, by Type -Revenue and Forecast to 2030 (US$ Million)
Table 7. Australia: Asia Pacific Power and Control Market, by Voltage -Revenue and Forecast to 2030 (US$ Million)
Table 8. Australia: Asia Pacific Power and Control Market, by Application -Revenue and Forecast to 2030 (US$ Million)
Table 9. China: Asia Pacific Power and Control Market, by Type -Revenue and Forecast to 2030 (US$ Million)
Table 10. China: Asia Pacific Power and Control Market, by Voltage -Revenue and Forecast to 2030 (US$ Million)
Table 11. China: Asia Pacific Power and Control Market, by Application -Revenue and Forecast to 2030 (US$ Million)
Table 12. India: Asia Pacific Power and Control Market, by Type -Revenue and Forecast to 2030 (US$ Million)
Table 13. India: Asia Pacific Power and Control Market, by Voltage -Revenue and Forecast to 2030 (US$ Million)
Table 14. India: Asia Pacific Power and Control Market, by Application -Revenue and Forecast to 2030 (US$ Million)
Table 15. Japan: Asia Pacific Power and Control Market, by Type -Revenue and Forecast to 2030 (US$ Million)
Table 16. Japan: Asia Pacific Power and Control Market, by Voltage -Revenue and Forecast to 2030 (US$ Million)
Table 17. Japan: Asia Pacific Power and Control Market, by Application -Revenue and Forecast to 2030 (US$ Million)
Table 18. South Korea: Asia Pacific Power and Control Market, by Type -Revenue and Forecast to 2030 (US$ Million)
Table 19. South Korea: Asia Pacific Power and Control Market, by Voltage -Revenue and Forecast to 2030 (US$ Million)
Table 20. South Korea: Asia Pacific Power and Control Market, by Application -Revenue and Forecast to 2030 (US$ Million)
Table 21. Rest of Asia Pacific: Asia Pacific Power and Control Market, by Type -Revenue and Forecast to 2030 (US$ Million)
Table 22. Rest of Asia Pacific: Asia Pacific Power and Control Market, by Voltage -Revenue and Forecast to 2030 (US$ Million)
Table 23. Rest of Asia Pacific: Asia Pacific Power and Control Market, by Application -Revenue and Forecast to 2030 (US$ Million)
Table 24. Heat Map Analysis By Key Players
Table 25. List of Abbreviation
List of Figures
Figure 1. Asia Pacific Power and Control Market Segmentation, By Country
Figure 2. Asia Pacific PEST Analysis
Figure 3. Ecosystem: Asia Pacific Power and Control Cable Market
Figure 4. Impact Analysis of Drivers and Restraints
Figure 5. Asia Pacific Power and Control Market Revenue (US$ Million), 2022 - 2030
Figure 6. Asia Pacific Power and Control Market Share (%) -Type, 2022 and 2030
Figure 7. Power Cable Market Revenue and Forecasts To 2030 (US$ Million)
Figure 8. Control Cable Market Revenue and Forecasts To 2030 (US$ Million)
Figure 9. Asia Pacific Power and Control Market Share (%) - Voltage, 2022 and 2030
Figure 10. Low Voltage Market Revenue and Forecasts To 2030 (US$ Million)
Figure 11. Medium Voltage Market Revenue and Forecasts To 2030 (US$ Million)
Figure 12. High Voltage Market Revenue and Forecasts To 2030 (US$ Million)
Figure 13. Asia Pacific Power and Control Market Share (%) - Application, 2022 and 2030
Figure 14. Utilities Market Revenue and Forecasts To 2030 (US$ Million)
Figure 15. Industrial Market Revenue and Forecasts To 2030 (US$ Million)
Figure 16. Asia Pacific: Power and Control Market, by Key Country - Revenue (2022) (US$ Million)
Figure 17. Asia Pacific: Asia Pacific Power and Control Market Revenue Share, by Key Country (2022 and 2030)
Figure 18. Australia: Asia Pacific Power and Control Market - Revenue, and Forecast to 2030 (US$ Million)
Figure 19. China: Asia Pacific Power and Control Market - Revenue, and Forecast to 2030 (US$ Million)
Figure 20. India: Asia Pacific Power and Control Market - Revenue, and Forecast to 2030 (US$ Million)
Figure 21. Japan: Asia Pacific Power and Control Market - Revenue, and Forecast to 2030 (US$ Million)
Figure 22. South Korea: Asia Pacific Power and Control Market - Revenue, and Forecast to 2030 (US$ Million)
Figure 23. Rest of Asia Pacific: Asia Pacific Power and Control Market - Revenue, and Forecast to 2030 (US$ Million)
Figure 24. Company Positioning & Concentration
1. Belden Inc
2. Furukawa Electric Co Ltd
3. HENGTONG GROUP CO., LTD.
4. LEONI AG
5. Nexans SA
6. Prysmian SpA
7. Sumitomo Electric Industries Ltd
- Save and reduce time carrying out entry-level research by identifying the growth, size, leading players, and segments in the Asia Pacific power and control cable market.
- Highlights key business priorities in order to assist companies to realign their business strategies
- The key findings and recommendations highlight crucial progressive industry trends in the Asia Pacific power and control cable market, thereby allowing players across the value chain to develop effective long-term strategies
- Develop/modify business expansion plans by using substantial growth offering developed and emerging markets
- Scrutinize in-depth Asia Pacific market trends and outlook coupled with the factors driving the power and control cable market, as well as those hindering it
- Enhance the decision-making process by understanding the strategies that underpin commercial interest with respect to client products, segmentation, pricing, and distribution