人工知能(AI)と機械学習(ML)技術の進歩により、さまざまな業界で可能性の世界が開かれました。これらの変革的な技術は、イノベーション、自動化、効率化を推進し、光ファイバー市場にユニークな機会をもたらしています。AIとMLのアプリケーションが増え続けるにつれて、堅牢で高速なデータ伝送の需要が最も重要になります。光ファイバーネットワークは、最小限の遅延で大量のデータを処理できるため、AIとMLシステムの要件を満たすのに適しています。これらのテクノロジーは、リアルタイム分析、意思決定、予測機能のために、シームレスで信頼性の高いデータ転送に大きく依存しています。光ファイバー ネットワークが提供する低遅延と高帯域幅により、最小限の遅延でデータを転送できるため、AI および ML アルゴリズムの効率と有効性が確保されます。
さらに、ヘルスケア、金融、製造、輸送など、さまざまな業界の垂直分野で AI と ML の採用が拡大しており、強力な接続基盤が必要です。光ファイバー ネットワークは、AI および ML アプリケーションに必要な大量のデータ転送をサポートするために必要なインフラストラクチャを提供します。光ファイバーの高速機能により、サーバー、クラウド プラットフォーム、エッジ デバイス間でデータを高速に転送できるため、AI と ML のシームレスな操作が容易になります。さらに、AI および ML アプリケーションがより高度になるにつれて、エッジ コンピューティングと分散型データ処理の必要性が高まっています。遠隔地を接続し、長距離の高速データ転送を処理できる光ファイバー ネットワークは、効率的なエッジ コンピューティング インフラストラクチャを実現するために不可欠です。これにより、リアルタイムの意思決定が可能になり、集中型データセンターへの依存度が軽減され、AI および ML システムの応答時間が短縮され、全体的なパフォーマンスが向上します。
アジア太平洋地域の光ファイバー市場で事業を展開している大手企業には、Corning Inc、Prysmian Spa、Jiangsu Zhogtian Technology Co Ltd、Yangtze Optical Fiber and Cable Joint Stock Ltd、Fiberhome Telecommunication Technologies Co Ltd、CommScope Holding Co Inc、Nexans SA、Furukawa Electric Co Ltd、Sumitomo Electric Industries Ltd、Coherenet Corpなどがあります。
Asia Pacific Optical Fiber Strategic Insights
Strategic insights for Asia Pacific Optical Fiber involve closely monitoring industry trends, consumer behaviours, and competitor actions to identify opportunities for growth. By leveraging data analytics, businesses can anticipate market shifts and make informed decisions that align with evolving customer needs. Understanding these dynamics helps companies adjust their strategies proactively, enhance customer engagement, and strengthen their competitive edge. Building strong relationships with stakeholders and staying agile in response to changes ensures long-term success in any market.
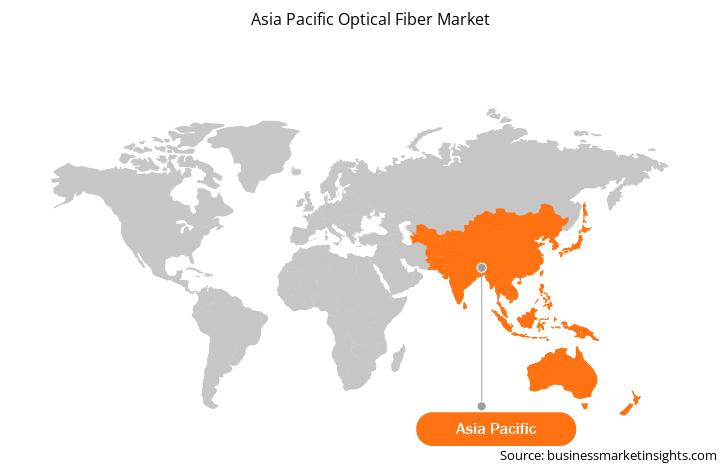
The regional scope of Asia Pacific Optical Fiber refers to the geographical area in which a business operates and competes. Understanding regional nuances, such as local consumer preferences, economic conditions, and regulatory environments, is crucial for tailoring strategies to specific markets. Businesses can expand their reach by identifying underserved regions or adapting their offerings to meet regional demands. A clear regional focus allows for more effective resource allocation, targeted marketing, and better positioning against local competitors, ultimately driving growth in those specific areas.
Get more information on this report
Identical Market Reports with other Region/Countries
The List of Companies - Asia Pacific Optical Fiber Market
1. Corning Inc
2. Prysmian Spa
3. Jiangsu Zhogtian Technology Co Ltd
4. Yangtze Optical Fiber and Cable Joint Stock Ltd
5. Fiberhome Telecommunication Technologies Co Ltd
6. CommScope Holding Co Inc
7. Nexans SA
8. Furukawa Electric Co Ltd
9. Sumitomo Electric Industries Ltd
10. Coherent Corp
Frequently Asked Questions
How big is the Asia Pacific Optical Fiber Market?
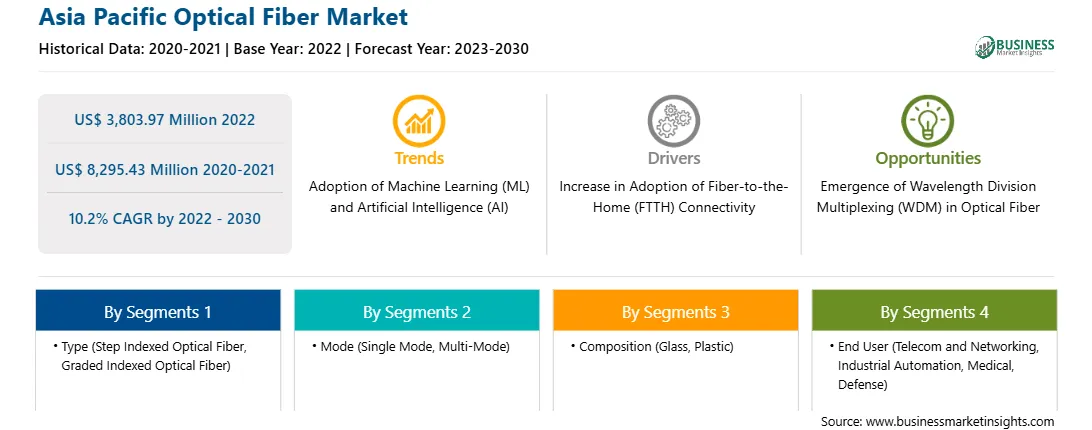
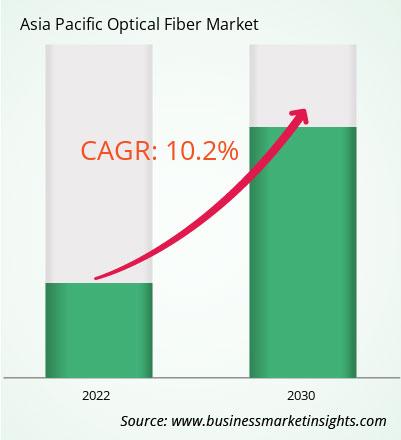
The Asia Pacific Optical Fiber Market is valued at US$ 3,803.97 Million in 2022, it is projected to reach US$ 8,295.43 Million by 2030.
What is the CAGR for Asia Pacific Optical Fiber Market by (2022 - 2030)?
As per our report Asia Pacific Optical Fiber Market, the market size is valued at US$ 3,803.97 Million in 2022, projecting it to reach US$ 8,295.43 Million by 2030. This translates to a CAGR of approximately 10.2% during the forecast period.
What segments are covered in this report?
The Asia Pacific Optical Fiber Market report typically cover these key segments-
タイプ (ステップインデックス光ファイバー, グレーデッドインデックス光ファイバー)
モード (シングルモード, マルチモード)
構成 (ガラス, プラスチック)
What is the historic period, base year, and forecast period taken for Asia Pacific Optical Fiber Market?
The historic period, base year, and forecast period can vary slightly depending on the specific market research report. However, for the Asia Pacific Optical Fiber Market report:
Historic Period : 2020-2021
Base Year : 2022
Forecast Period : 2023-2030
Who are the major players in Asia Pacific Optical Fiber Market?
The Asia Pacific Optical Fiber Market is populated by several key players, each contributing to its growth and innovation. Some of the major players include:
Corning Inc
Prysmian Spa
Jiangsu Zhogtian Technology Co Ltd
Yangtze Optical Fiber and Cable Joint Stock Ltd
Fiberhome Telecommunication Technologies Co Ltd
CommScope Holding Co Inc
Nexans SA
Furukawa Electric Co Ltd
Sumitomo Electric Industries Ltd
Coherent Corp
Who should buy this report?
The Asia Pacific Optical Fiber Market report is valuable for diverse stakeholders, including:
Investors: Provides insights for investment decisions pertaining to market growth, companies, or industry insights. Helps assess market attractiveness and potential returns.
Industry Players: Offers competitive intelligence, market sizing, and trend analysis to inform strategic planning, product development, and sales strategies.
Suppliers and Manufacturers: Helps understand market demand for components, materials, and services related to concerned industry.
Researchers and Consultants: Provides data and analysis for academic research, consulting projects, and market studies.
Financial Institutions: Helps assess risks and opportunities associated with financing or investing in the concerned market.
Essentially, anyone involved in or considering involvement in the Asia Pacific Optical Fiber Market value chain can benefit from the information contained in a comprehensive market report.
Get Free Sample For Asia Pacific Optical Fiber Market
1. Complete the form
2. Check your inbox (and spam/junk folder)
3. Your Personal Data is Secure with us
GDPR + CCPA Compliant
Personal & transactional information is kept safe from unauthorized use.
WHAT'S INCLUDED IN FULL REPORT : Market Dynamics,
Competitive Analysis and Assessment, Define Business Strategies, Market Outlook and
Trends, Market Size and Share Analysis, Growth Driving Factors, Future Commercial
Potential, Identify Regional Growth Engines


 Get Free Sample For Asia Pacific Optical Fiber Market

