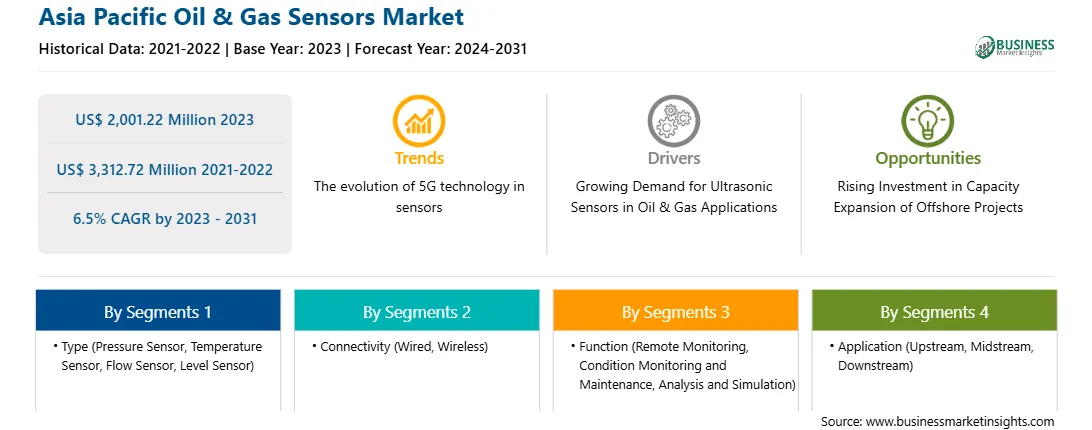
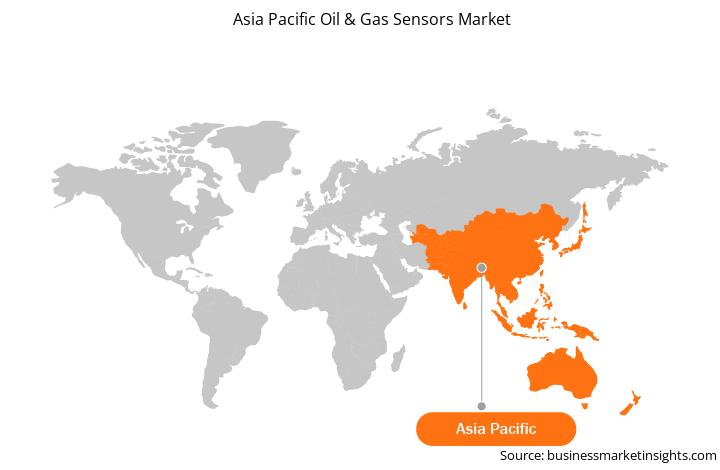
アジア太平洋地域の石油・ガスセンサー市場予測 - 2031年まで - 地域別分析 - タイプ別(圧力センサー、温度センサー、フローセンサー、レベルセンサー)、接続性(有線および無線)、機能別(リモート監視、状態監視およびメンテナンス、分析およびシミュレーションなど)、アプリケーション別(上流、中流、下流)

BMIRE00031063 | Pages: 116 | Electronics and Semiconductor | Dec 2024 | Status: Published
アジア太平洋地域の石油・ガスセンサー市場は、2023年に20億122万米ドルと評価され、2031年までに33億1272万米ドルに達すると予想されています。また、2023年から2031年にかけて6.5%のCAGRを記録すると予測されています。

オフショアプロジェクトの容量拡大への投資増加により、アジア太平洋地域の石油・ガスセンサー市場が拡大

オフショア風力や海洋エネルギーなどのオフショア再生可能エネルギーは、世界的なエネルギー転換を加速させるとともに、新たな経済的・社会的機会を生み出す可能性があります。国際再生可能エネルギー機関(IRENA)が2023年6月に発表した最新データによると、洋上風力の容量は2022年には18倍から55ギガワット(GW)以上に増加しているのに対し、海洋エネルギーの設置容量は2021年には0.535GWでした。海洋エネルギー技術への投資の増加により、洋上風力と海洋エネルギーは2030年までにそれぞれ380GWと350GWを生成できます。これにより、水質の監視、油流出の検出、洋上掘削活動による石油・ガス用途への影響の評価を目的とした石油・ガスセンサーの採用がユーザーの間で増加しています。さらに、洋上プロジェクトへの投資の増加が市場を後押ししています。これにより、洋上風力タービン、石油プラットフォーム、海中パイプラインの性能と健全性を監視するための温度、圧力、流量、レベルセンサーの需要と採用が増加しています。

アジア太平洋地域の石油・ガスセンサー市場の概要

アジア太平洋地域の温度センサー市場は、原油、バイオ燃料、その他の石油液体の消費量の増加により、予測期間中に著しいペースで拡大すると予想されています。米国エネルギー情報局のデータによると、2022年には中国とインドの石油消費量はそれぞれ1日あたり1,515万バレルと505万バレルとなり、世界全体の石油消費量の15%と5%を占めています。中国とインドの企業は原油を電気やその他の再生可能エネルギーに変換する需要が非常に高く、石油・ガス市場のプレーヤーは生産能力の増強を余儀なくされています。さらに、石油・ガスプラントの生産能力拡大のニーズが高まっていることから、今後数年間で温度センサー、圧力センサー、フローセンサー、オイルセンサーの採用が促進される可能性があります。センサーは、リアルタイムのデータ監視とアラームを確実にするために、生産プラント全体に戦略的に配置されています。

アジア太平洋地域の石油・ガスセンサー市場の収益と2031年までの予測(百万米ドル)

アジア太平洋地域の石油・ガスセンサー市場のセグメンテーション

アジア太平洋地域の石油・ガスセンサー市場は、タイプ、接続性、機能、アプリケーション、国に分類されています。

タイプに基づいて、アジア太平洋地域の石油・ガスセンサー市場は、圧力センサー、温度センサー、フローセンサー、レベルセンサーに分割されています。圧力センサーセグメントは、2023年に最大の市場シェアを占めました。

接続性に関しては、アジア太平洋地域の石油・ガスセンサー市場は、有線と無線に分かれています。有線セグメントは、2023年に大きな市場シェアを占めました。

機能別に、アジア太平洋地域の石油・ガスセンサー市場は、リモート監視、状態監視とメンテナンス、分析とシミュレーション、その他に分割されています。リモートモニタリングセグメントは、2023年に最大の市場シェアを占めました。

アプリケーション別に見ると、アジア太平洋地域の石油・ガスセンサー市場は、上流、中流、下流に分かれています。上流セグメントは、2023年に最大の市場シェアを占めました。

国別に見ると、アジア太平洋地域の石油・ガスセンサー市場は、インド、中国、日本、韓国、オーストラリア、その他のアジア太平洋地域に分かれています。2023年には、中国がアジア太平洋地域の石油・ガスセンサー市場シェアを独占しました。

Honeywell International Inc、TE Connectivity Ltd、Robert Bosch GmbH、ABB Ltd、Siemens AG、Rockwell Automation Inc、Analog Devices Inc、Emerson Electric Co、SKF AB、GE Vernovaは、アジア太平洋地域の石油・ガスセンサー市場で事業を展開している大手企業の一部です。

1.           Introduction

1.1       The Insight Partners Research Report Guidance

1.2       Market Segmentation

2.           Executive Summary

2.1       Key Insights

2.2       Market Attractiveness

3.           Research Methodology

3.1       Secondary Research

3.2       Primary Research

3.2.1         Hypothesis formulation:

3.2.2         Macro-economic factor analysis:

3.2.3         Developing base number:

3.2.4         Data Triangulation:

3.2.5         Country level data:

4.           Asia Pacific Oil & Gas Sensors Market Landscape

4.1       Overview

4.2       Ecosystem Analysis

4.2.1         List of Vendors in the Value Chain

5.           Asia Pacific Oil & Gas Sensors Market – Key Market Dynamics

5.1       Market Drivers

5.1.1         Growing Demand for Ultrasonic Sensors in Oil and Gas Applications

5.1.2         Expanding Oil and Gas Industry

5.1.3         Development of Internet of Things (IoT)-based Sensors

5.2       Market Restraints

5.2.1         High Costs Associated with Oil and Gas Sensors

5.3       Market Opportunities

5.3.1         Rising Investment in Capacity Expansion of Offshore Projects

5.3.2         Increasing Technological Advancements

5.4       Future Trends

5.4.1         Evolution of 5G Technology

5.5       Impact of Drivers and Restraints:

6.           Oil & Gas Sensors Market – Asia Pacific Analysis

6.1       Asia Pacific Oil & Gas Sensors Market Forecast Analysis

7.           Asia Pacific Oil & Gas Sensors Market Analysis – by Type

7.1       Pressure Sensor

7.1.1         Overview

7.1.2         Pressure Sensor: Asia Pacific Oil & Gas Sensors Market – Revenue and Forecast to 2031 (US$ Million)

7.2       Temperature Sensor

7.2.1         Overview

7.2.2         Temperature Sensor: Asia Pacific Oil & Gas Sensors Market – Revenue and Forecast to 2031  (US$ Million)

7.3       Flow Sensor

7.3.1         Overview

7.3.2         Flow Sensor: Asia Pacific Oil & Gas Sensors Market – Revenue and Forecast to 2031 (US$ Million)

7.4       Level Sensor

7.4.1         Overview

7.4.2         Level Sensor: Asia Pacific Oil & Gas Sensors Market – Revenue and Forecast to 2031 (US$ Million)

8.           Asia Pacific Oil & Gas Sensors Market Analysis – by Connectivity

8.1       Wired

8.1.1         Overview

8.1.2         Wired: Asia Pacific Oil & Gas Sensors Market – Revenue and Forecast to 2031 (US$ Million)

8.2       Wireless

8.2.1         Overview

8.2.2         Wireless: Asia Pacific Oil & Gas Sensors Market – Revenue and Forecast to 2031 (US$ Million)

9.           Asia Pacific Oil & Gas Sensors Market Analysis – by Function

9.1       Remote Monitoring

9.1.1         Overview

9.1.2         Remote Monitoring: Asia Pacific Oil & Gas Sensors Market – Revenue and Forecast to 2031 (US$ Million)

9.2       Condition Monitoring and Maintenance

9.2.1         Overview

9.2.2         Condition Monitoring and Maintenance: Asia Pacific Oil & Gas Sensors Market – Revenue and Forecast to 2031 (US$ Million)

9.3       Analysis and Simulation

9.3.1         Overview

9.3.2         Analysis and Simulation: Asia Pacific Oil & Gas Sensors Market – Revenue and Forecast to 2031  (US$ Million)

9.4       Others

9.4.1         Overview

9.4.2         Others: Asia Pacific Oil & Gas Sensors Market – Revenue and Forecast to 2031 (US$ Million)

10.        Asia Pacific Oil & Gas Sensors Market Analysis – by Application

10.1     Upstream

10.1.1       Overview

10.1.2       Upstream: Asia Pacific Oil & Gas Sensors Market – Revenue and Forecast to 2031 (US$ Million)

10.2     Midstream

10.2.1       Overview

10.2.2       Midstream: Asia Pacific Oil & Gas Sensors Market – Revenue and Forecast to 2031 (US$ Million)

10.3     Downstream

10.3.1       Overview

10.3.2       Downstream: Asia Pacific Oil & Gas Sensors Market – Revenue and Forecast to 2031 (US$ Million)

11.        Asia Pacific Oil & Gas Sensors Market – Country Analysis

11.1     Asia Pacific Oil & Gas Sensors Market Overview

11.1.1       Asia Pacific Oil & Gas Sensors Market Breakdown, by Key Countries, 2023 and 2031 (%)

11.1.1.1          Asia Pacific Oil & Gas Sensors Market – Revenue and Forecast Analysis – by Country

11.1.1.2          India: Asia Pacific Oil & Gas Sensors Market – Revenue and Forecast to 2031 (US$ Million)

11.1.1.2.1        India: Asia Pacific Oil & Gas Sensors Market Breakdown, by Type

11.1.1.2.2        India: Asia Pacific Oil & Gas Sensors Market Breakdown, by Connectivity

11.1.1.2.3        India: Asia Pacific Oil & Gas Sensors Market Breakdown, by Function

11.1.1.2.4        India: Asia Pacific Oil & Gas Sensors Market Breakdown, by Application

11.1.1.3          China: Asia Pacific Oil & Gas Sensors Market – Revenue and Forecast to 2031 (US$ Million)

11.1.1.3.1        China: Asia Pacific Oil & Gas Sensors Market Breakdown, by Type

11.1.1.3.2        China: Asia Pacific Oil & Gas Sensors Market Breakdown, by Connectivity

11.1.1.3.3        China: Asia Pacific Oil & Gas Sensors Market Breakdown, by Function

11.1.1.3.4        China: Asia Pacific Oil & Gas Sensors Market Breakdown, by Application

11.1.1.4          Japan: Asia Pacific Oil & Gas Sensors Market – Revenue and Forecast to 2031 (US$ Million)

11.1.1.4.1        Japan: Asia Pacific Oil & Gas Sensors Market Breakdown, by Type

11.1.1.4.2        Japan: Asia Pacific Oil & Gas Sensors Market Breakdown, by Connectivity

11.1.1.4.3        Japan: Asia Pacific Oil & Gas Sensors Market Breakdown, by Function

11.1.1.4.4        Japan: Asia Pacific Oil & Gas Sensors Market Breakdown, by Application

11.1.1.5          South Korea: Asia Pacific Oil & Gas Sensors Market – Revenue and Forecast to 2031 (US$ Million)

11.1.1.5.1        South Korea: Asia Pacific Oil & Gas Sensors Market Breakdown, by Type

11.1.1.5.2        South Korea: Asia Pacific Oil & Gas Sensors Market Breakdown, by Connectivity

11.1.1.5.3        South Korea: Asia Pacific Oil & Gas Sensors Market Breakdown, by Function

11.1.1.5.4        South Korea: Asia Pacific Oil & Gas Sensors Market Breakdown, by Application

11.1.1.6          Australia: Asia Pacific Oil & Gas Sensors Market – Revenue and Forecast to 2031 (US$ Million)

11.1.1.6.1        Australia: Asia Pacific Oil & Gas Sensors Market Breakdown, by Type

11.1.1.6.2        Australia: Asia Pacific Oil & Gas Sensors Market Breakdown, by Connectivity

11.1.1.6.3        Australia: Asia Pacific Oil & Gas Sensors Market Breakdown, by Function

11.1.1.6.4        Australia: Asia Pacific Oil & Gas Sensors Market Breakdown, by Application

11.1.1.7          Rest of APAC: Asia Pacific Oil & Gas Sensors Market – Revenue and Forecast to 2031 (US$ Million)

11.1.1.7.1        Rest of APAC: Asia Pacific Oil & Gas Sensors Market Breakdown, by Type

11.1.1.7.2        Rest of APAC: Asia Pacific Oil & Gas Sensors Market Breakdown, by Connectivity

11.1.1.7.3        Rest of APAC: Asia Pacific Oil & Gas Sensors Market Breakdown, by Function

11.1.1.7.4        Rest of APAC: Asia Pacific Oil & Gas Sensors Market Breakdown, by Application

12.        Competitive Landscape

12.1     Heat Map Analysis by Key Players

12.2     Company Positioning & Concentration

13.        Industry Landscape

13.1     Overview

13.2     Market Initiative

13.3     Product News & Company News

14.        Company Profiles

14.1     Honeywell International Inc

14.1.1       Key Facts

14.1.2       Business Description

14.1.3       Products and Services

14.1.4       Financial Overview

14.1.5       SWOT Analysis

14.1.6       Key Developments

14.2     TE Connectivity Ltd

14.2.1       Key Facts

14.2.2       Business Description

14.2.3       Products and Services

14.2.4       Financial Overview

14.2.5       SWOT Analysis

14.2.6       Key Developments

14.3     Robert Bosch GmbH

14.3.1       Key Facts

14.3.2       Business Description

14.3.3       Products and Services

14.3.4       Financial Overview

14.3.5       SWOT Analysis

14.3.6       Key Developments

14.4     ABB Ltd

14.4.1       Key Facts

14.4.2       Business Description

14.4.3       Products and Services

14.4.4       Financial Overview

14.4.5       SWOT Analysis

14.4.6       Key Developments

14.5     Siemens AG

14.5.1       Key Facts

14.5.2       Business Description

14.5.3       Products and Services

14.5.4       Financial Overview

14.5.5       SWOT Analysis

14.5.6       Key Developments

14.6     Rockwell Automation Inc

14.6.1       Key Facts

14.6.2       Business Description

14.6.3       Products and Services

14.6.4       Financial Overview

14.6.5       SWOT Analysis

14.6.6       Key Developments

14.7     Analog Devices Inc

14.7.1       Key Facts

14.7.2       Business Description

14.7.3       Products and Services

14.7.4       Financial Overview

14.7.5       SWOT Analysis

14.7.6       Key Developments

14.8     Emerson Electric Co

14.8.1       Key Facts

14.8.2       Business Description

14.8.3       Products and Services

14.8.4       Financial Overview

14.8.5       SWOT Analysis

14.8.6       Key Developments

14.9     SKF AB

14.9.1       Key Facts

14.9.2       Business Description

14.9.3       Products and Services

14.9.4       Financial Overview

14.9.5       SWOT Analysis

14.9.6       Key Developments

14.10  GE Vernova

14.10.1    Key Facts

14.10.2    Business Description

14.10.3    Products and Services

14.10.4    Financial Overview

14.10.5    SWOT Analysis

14.10.6    Key Developments

15.        Appendix

15.1     About The Insight Partners

15.2     Word Index


List of Tables

Table 1.             Asia Pacific Oil & Gas Sensors Market Segmentation

Table 2.             List of Vendors

Table 3.             Asia Pacific Oil & Gas Sensors Market – Revenue and Forecast to 2031 (US$ Million)

Table 4.             Asia Pacific Oil & Gas Sensors Market – Revenue and Forecast to 2031 (US$ Million) – by Type

Table 5.             Asia Pacific Oil & Gas Sensors Market – Revenue and Forecast to 2031 (US$ Million) – by Connectivity

Table 6.             Asia Pacific Oil & Gas Sensors Market – Revenue and Forecast to 2031 (US$ Million) – by Function

Table 7.             Asia Pacific Oil & Gas Sensors Market – Revenue and Forecast to 2031 (US$ Million) – by Application

Table 8.             Asia Pacific Oil & Gas Sensors Market – Revenue and Forecast to 2031 (US$ Million) – by Country

Table 9.             India: Asia Pacific Oil & Gas Sensors Market – Revenue and Forecast to 2031 (US$ Million) – by Type

Table 10.          India: Asia Pacific Oil & Gas Sensors Market – Revenue and Forecast to 2031 (US$ Million) – by Connectivity

Table 11.          India: Asia Pacific Oil & Gas Sensors Market – Revenue and Forecast to 2031 (US$ Million) – by Function

Table 12.          India: Asia Pacific Oil & Gas Sensors Market – Revenue and Forecast to 2031 (US$ Million) – by Application

Table 13.          China: Asia Pacific Oil & Gas Sensors Market – Revenue and Forecast to 2031 (US$ Million) – by Type

Table 14.          China: Asia Pacific Oil & Gas Sensors Market – Revenue and Forecast to 2031 (US$ Million) – by Connectivity

Table 15.          China: Asia Pacific Oil & Gas Sensors Market – Revenue and Forecast to 2031 (US$ Million) – by Function

Table 16.          China: Asia Pacific Oil & Gas Sensors Market – Revenue and Forecast to 2031 (US$ Million) – by Application

Table 17.          Japan: Asia Pacific Oil & Gas Sensors Market – Revenue and Forecast to 2031 (US$ Million) – by Type

Table 18.          Japan: Asia Pacific Oil & Gas Sensors Market – Revenue and Forecast to 2031 (US$ Million) – by Connectivity

Table 19.          Japan: Asia Pacific Oil & Gas Sensors Market – Revenue and Forecast to 2031 (US$ Million) – by Function

Table 20.          Japan: Asia Pacific Oil & Gas Sensors Market – Revenue and Forecast to 2031 (US$ Million) – by Application

Table 21.          South Korea: Asia Pacific Oil & Gas Sensors Market – Revenue and Forecast to 2031 (US$ Million) – by Type

Table 22.          South Korea: Asia Pacific Oil & Gas Sensors Market – Revenue and Forecast to 2031 (US$ Million) – by Connectivity

Table 23.          South Korea: Asia Pacific Oil & Gas Sensors Market – Revenue and Forecast to 2031 (US$ Million) – by Function

Table 24.          South Korea: Asia Pacific Oil & Gas Sensors Market – Revenue and Forecast to 2031 (US$ Million) – by Application

Table 25.          Australia: Asia Pacific Oil & Gas Sensors Market – Revenue and Forecast to 2031 (US$ Million) – by Type

Table 26.          Australia: Asia Pacific Oil & Gas Sensors Market – Revenue and Forecast to 2031 (US$ Million) – by Connectivity

Table 27.          Australia: Asia Pacific Oil & Gas Sensors Market – Revenue and Forecast to 2031 (US$ Million) – by Function

Table 28.          Australia: Asia Pacific Oil & Gas Sensors Market – Revenue and Forecast to 2031 (US$ Million) – by Application

Table 29.          Rest of APAC: Asia Pacific Oil & Gas Sensors Market – Revenue and Forecast to 2031 (US$ Million) – by Type

Table 30.          Rest of APAC: Asia Pacific Oil & Gas Sensors Market – Revenue and Forecast to 2031 (US$ Million) – by Connectivity

Table 31.          Rest of APAC: Asia Pacific Oil & Gas Sensors Market – Revenue and Forecast to 2031 (US$ Million) – by Function

Table 32.          Rest of APAC: Asia Pacific Oil & Gas Sensors Market – Revenue and Forecast to 2031 (US$ Million) – by Application

Table 33.          List of Abbreviation


List of Figures

Figure 1.           Asia Pacific Oil & Gas Sensors Market Segmentation, by Country

Figure 2.           Asia Pacific Oil & Gas Sensors Market – Key Market Dynamics

Figure 3.           Impact Analysis of Drivers and Restraints

Figure 4.           Asia Pacific Oil & Gas Sensors Market Revenue (US$ Million), 2021–2031

Figure 5.           Asia Pacific Oil & Gas Sensors Market Share (%) – by Type (2023 and 2031)

Figure 6.           Pressure Sensor: Asia Pacific Oil & Gas Sensors Market – Revenue and Forecast to 2031 (US$ Million)

Figure 7.           Temperature Sensor: Asia Pacific Oil & Gas Sensors Market – Revenue and Forecast to 2031 (US$ Million)

Figure 8.           Flow Sensor: Asia Pacific Oil & Gas Sensors Market – Revenue and Forecast to 2031 (US$ Million)

Figure 9.           Level Sensor: Asia Pacific Oil & Gas Sensors Market – Revenue and Forecast to 2031 (US$ Million)

Figure 10.        Asia Pacific Oil & Gas Sensors Market Share (%) – by Connectivity (2023 and 2031)

Figure 11.        Wired: Asia Pacific Oil & Gas Sensors Market – Revenue and Forecast to 2031 (US$ Million)

Figure 12.        Wireless: Asia Pacific Oil & Gas Sensors Market – Revenue and Forecast to 2031 (US$ Million)

Figure 13.        Asia Pacific Oil & Gas Sensors Market Share (%) – by Function (2023 and 2031)

Figure 14.        Remote Monitoring: Asia Pacific Oil & Gas Sensors Market – Revenue and Forecast to 2031 (US$ Million)

Figure 15.        Condition Monitoring and Maintenance: Asia Pacific Oil & Gas Sensors Market – Revenue and Forecast to 2031  (US$ Million)

Figure 16.        Analysis and Simulation: Asia Pacific Oil & Gas Sensors Market – Revenue and Forecast to 2031 (US$ Million)

Figure 17.        Others: Asia Pacific Oil & Gas Sensors Market – Revenue and Forecast to 2031 (US$ Million)

Figure 18.        Asia Pacific Oil & Gas Sensors Market Share (%) – by Application (2023 and 2031)

Figure 19.        Upstream: Asia Pacific Oil & Gas Sensors Market – Revenue and Forecast to 2031 (US$ Million)

Figure 20.        Midstream: Asia Pacific Oil & Gas Sensors Market – Revenue and Forecast to 2031 (US$ Million)

Figure 21.        Downstream: Asia Pacific Oil & Gas Sensors Market – Revenue and Forecast to 2031 (US$ Million)

Figure 22.        Asia Pacific Oil & Gas Sensors Market Breakdown, by Key Countries – Revenue (2023) (US$ Million)

Figure 23.        Asia Pacific Oil & Gas Sensors Market Breakdown, by Key Countries, 2023 and 2031 (%)

Figure 24.        India: Asia Pacific Oil & Gas Sensors Market – Revenue and Forecast to 2031 (US$ Million)

Figure 25.        China: Asia Pacific Oil & Gas Sensors Market – Revenue and Forecast to 2031 (US$ Million)

Figure 26.        Japan: Asia Pacific Oil & Gas Sensors Market – Revenue and Forecast to 2031 (US$ Million)

Figure 27.        South Korea: Asia Pacific Oil & Gas Sensors Market – Revenue and Forecast to 2031 (US$ Million)

Figure 28.        Australia: Asia Pacific Oil & Gas Sensors Market – Revenue and Forecast to 2031 (US$ Million)

Figure 29.        Rest of APAC: Asia Pacific Oil & Gas Sensors Market – Revenue and Forecast to 2031 (US$ Million)

Figure 30.        Heat Map Analysis by Key Players

Figure 31.        Company Positioning & Concentration

  • ABB Ltd                                              
  • Analog Devices Inc                         
  • Emerson Electric Co                       
  • GE Vernova                                         
  • Honeywell International Inc      
  • Robert Bosch GmbH                   
  • Rockwell Automation Inc          
  • Siemens AG                                       
  • SKF AB
  • TE Connectivity Ltd                     
  • Save and reduce time carrying out entry-level research by identifying the growth, size, leading players, and segments in the Asia Pacific oil & gas sensors market.    
  • Highlights key business priorities in order to assist companies to realign their business strategies.
  • The key findings and recommendations highlight crucial progressive industry trends in the Asia Pacific oil & gas sensors market, thereby allowing players across the value chain to develop effective long-term strategies.
  • Develop/modify business expansion plans by using substantial growth offering developed and emerging markets.
  • Scrutinize in-depth Asia Pacific market trends and outlook coupled with the factors driving the Asia Pacific oil & gas sensors market, as well as those hindering it.
  • Enhance the decision-making process by understanding the strategies that underpin commercial interest with respect to client products, segmentation, pricing, and distribution.
Report Code
Full Name
Country Name
Email Id
Phone Number
Job Title
Company
Requirement

Note : Your data will never be shared with third parties, however, we may send you information from time to time about our products that may be of interest to you. By submitting your details, you agree to be contacted by us. You may contact us at any time to opt-out.


Purchase Options
Single User License
$3550
$2840
Site License
$4550
$3640
Enterprise License
$5550
$4440