2028年までのアジア太平洋ダイアグラムソフトウェア市場予測 – 導入タイプ別(クラウドおよびオンプレミス)、企業規模別(中小企業および大企業)、およびアプリケーション別(教育機関、企業、およびアプリケーション別)の新型コロナウイルス感染症の影響と地域分析個人的)
No. of Pages: 72 | Report Code: TIPRE00025753 | Category: Technology, Media and Telecommunications
No. of Pages: 72 | Report Code: TIPRE00025753 | Category: Technology, Media and Telecommunications
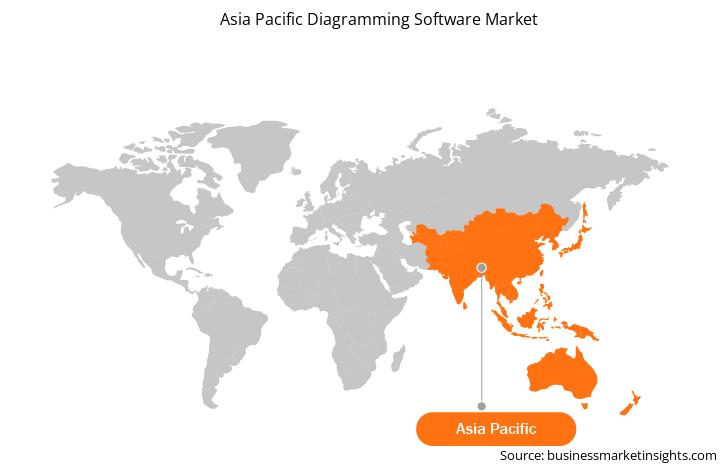
発展途上国の存在と、先進的かつ洗練されたテクノロジーの高度な採用は、全体的な成長に寄与する要因の 1 つです。アジア太平洋地域の。日本、中国、インド、オーストラリア、韓国は、この地域の作図ソフトウェア市場の成長に大きく貢献しています。政府による重要な取り組み、経済のデジタル化、急速な技術開発、中間所得層の可処分所得の増加は、この地域の経済全体の成長を促進する要因の一つであり、それによって同地域を発展途上段階から発展段階へと押し上げています。クラウドベースの作図ソフトウェア プラットフォームの人気の高まりにより、APAC における作図ソフトウェアの需要が高まっています。さらに、大企業や教育機関によるこれらのソフトウェアの採用の増加とテクノロジーの進歩により、APAC諸国の作図ソフトウェア市場の成長が促進されています。アジア太平洋地域は、ソフトウェアに対する企業と政府の支出の増加(約1,300億米ドル)により、予測期間中に世界の作図ソフトウェア市場で最高のCAGRを記録すると予測されています。インターネットへのアクセスの増加とテクノロジーに精通した個人の存在の増加は、この分野での作図ソフトウェアなどの高度なソフトウェアの使用範囲の拡大に関連している可能性があります。
新型コロナウイルス感染症(COVID-19)のパンデミックは、病気の広範な蔓延によりアジア太平洋地域に深刻な影響を与えています。この地域の国々は世界で最も人口の多い国の一つであり、感染拡大のリスクがより高くなります。多くの世界的なブランドやテクノロジー企業が APAC に本社を置いています。経済協力開発機構(OECD)によると、パンデミックはインフレを経験している中国、インド、オーストラリア、日本などの主要国に悪影響を及ぼしている。新型コロナウイルス感染症(COVID-19)の急速な感染拡大により、2020 年初頭から地域全体で厳格なロックダウンが実施されました。
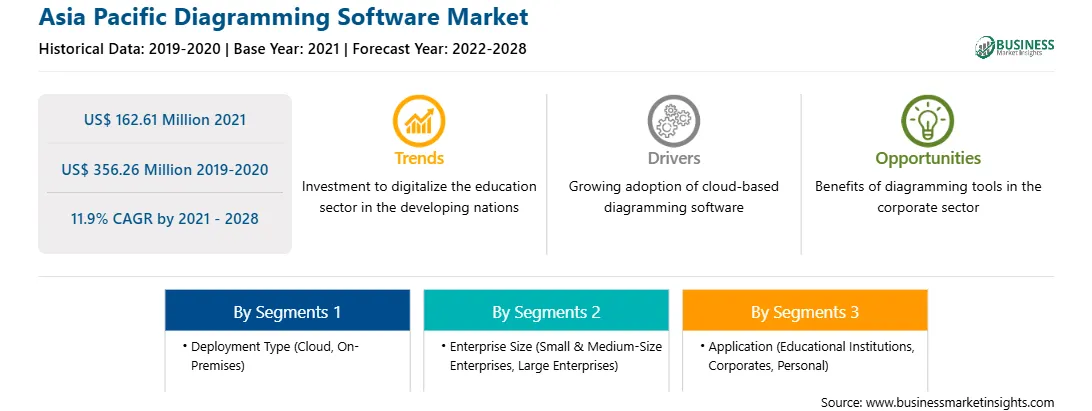
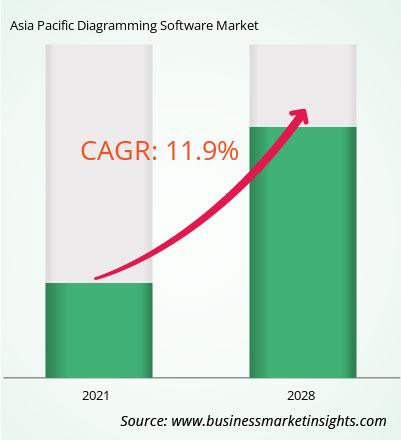
作図ソフトウェアAPAC市場は2021年の1億6,261万米ドルから2028年までに3億5,626万米ドルに成長すると予想されています。 2021 年から 2028 年までに 11.9% の CAGR で成長すると推定されています。先進テクノロジーと作図ソフトウェアの統合。文書化と図表作成の自動化は、人間による繰り返しの作業を排除するために、あらゆる業界で高度に導入されています。人工知能 (AI) などのテクノロジーは作図ソフトウェアと統合されており、フローチャート、組織図、マッピング図、ワークフローの作成を自動化します。 AI などの高度なテクノロジーと作図ソリューションを統合することで、事前に入力した基準に基づいてチャートの作成と更新の両方を自動化できるようになりました。たとえば、Edrawsoft は、企業が基本的な組織図、写真組織図、家系図、カスタム組織図、人物組織図などのさまざまな形式で組織図を作成できるようにする、ベクトルベースの自動組織図作成ソリューションを提供しています。このソリューションは人事システムと統合されており、そのようなシステムで利用可能な情報と指定に基づいてグラフを自動的に作成します。このソリューションは、従業員が組織を退職したときにも情報を自動的に更新します。これらの利点は、技術的に高度な作図ソフトウェアの採用に影響を与えると予想されます。したがって、上記の要因は、予測期間中にAPAC図作成ソフトウェア市場の成長を推進すると予想されます。これにより、作図ソフトウェア市場の成長が促進されています。
展開タイプに基づいて、作図ソフトウェア市場はクラウドとオンプレミスに二分化されます。 2020 年、クラウド部門は APAC 製図ソフトウェア市場で最大のシェアを占めました。企業規模に基づいて、作図ソフトウェア市場は小規模と小規模に分類されます。中堅企業と大企業。 2020 年、大企業セグメントが APAC 製図ソフトウェア市場で最大のシェアを占めました。アプリケーションに基づいて、作図ソフトウェアは教育機関、企業、個人向けに分類できます。 2020 年は法人部門が大きなシェアを占めました。
Strategic insights for Asia Pacific Diagramming Software involve closely monitoring industry trends, consumer behaviours, and competitor actions to identify opportunities for growth. By leveraging data analytics, businesses can anticipate market shifts and make informed decisions that align with evolving customer needs. Understanding these dynamics helps companies adjust their strategies proactively, enhance customer engagement, and strengthen their competitive edge. Building strong relationships with stakeholders and staying agile in response to changes ensures long-term success in any market.
| Report Attribute | Details |
|---|---|
| Market size in 2021 | US$ 162.61 Million |
| Market Size by 2028 | US$ 356.26 Million |
| Global CAGR (2021 - 2028) | 11.9% |
| Historical Data | 2019-2020 |
| Forecast period | 2022-2028 |
| Segments Covered |
By 展開タイプ
|
| Regions and Countries Covered | アジア太平洋
|
| Market leaders and key company profiles |
The regional scope of Asia Pacific Diagramming Software refers to the geographical area in which a business operates and competes. Understanding regional nuances, such as local consumer preferences, economic conditions, and regulatory environments, is crucial for tailoring strategies to specific markets. Businesses can expand their reach by identifying underserved regions or adapting their offerings to meet regional demands. A clear regional focus allows for more effective resource allocation, targeted marketing, and better positioning against local competitors, ultimately driving growth in those specific areas.
The Asia Pacific Diagramming Software Market is valued at US$ 162.61 Million in 2021, it is projected to reach US$ 356.26 Million by 2028.
As per our report Asia Pacific Diagramming Software Market, the market size is valued at US$ 162.61 Million in 2021, projecting it to reach US$ 356.26 Million by 2028. This translates to a CAGR of approximately 11.9% during the forecast period.
The Asia Pacific Diagramming Software Market report typically cover these key segments-
The historic period, base year, and forecast period can vary slightly depending on the specific market research report. However, for the Asia Pacific Diagramming Software Market report:
The Asia Pacific Diagramming Software Market is populated by several key players, each contributing to its growth and innovation. Some of the major players include:
The Asia Pacific Diagramming Software Market report is valuable for diverse stakeholders, including:
Essentially, anyone involved in or considering involvement in the Asia Pacific Diagramming Software Market value chain can benefit from the information contained in a comprehensive market report.
Office No. 1011, First floor, Farena Corporate Park, Magarpatta-Mundhwa road, Pune - 411028, Maharashtra, India
US:+16467917070
sales@businessmarketinsights.com


 Get Free Sample For Asia Pacific Diagramming Software Market
