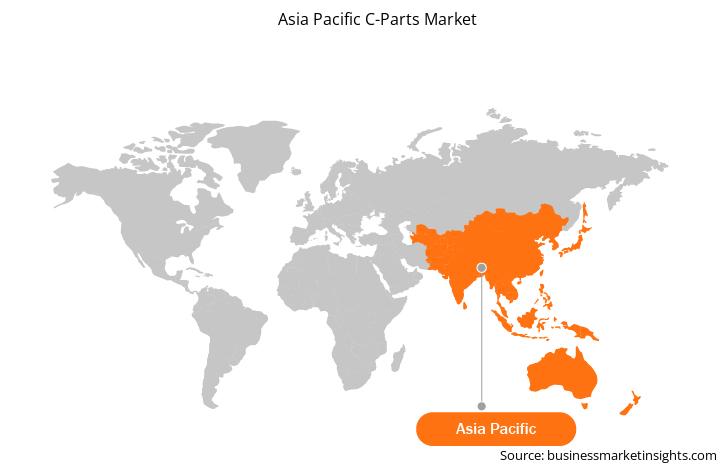
アジア太平洋地域のCパーツ市場規模と予測(2021〜2031年)、トレンド、成長機会分析レポートの対象範囲:製品タイプ(ファスナー、ベアリング、その他)、最終用途産業(自動車、航空宇宙および防衛、エネルギーおよび電力、半導体、その他)、材料タイプ(鋼/ステンレス鋼、プラスチック/複合材料、鋳鉄、鋼合金、その他)、国別

BMIRE00030867 | Pages: 130 | Manufacturing and Construction | Sep 2024 | Status: Published

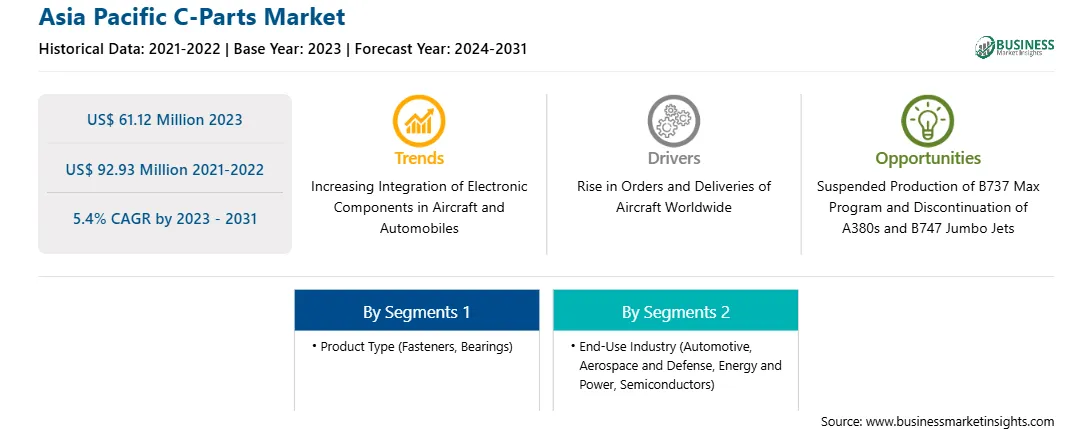
アジア太平洋地域のCパーツ市場規模は、2023年の6,112万米ドルから2031年には9,293万米ドルに達すると予測されています。市場は2023年から2031年の間に5.4%のCAGRを記録すると予想されています。航空機と自動車への電子部品の統合の増加は、今後数年間でアジア太平洋地域のCパーツ市場に新しいトレンドをもたらす可能性があります。

車両と航空機への電子部品の統合の増加は、今後数年間でアジア太平洋地域のCパーツ市場を牽引する可能性のある主要なトレンドの1つです。

さらに、電気自動車と電気航空機の導入は、近い将来に市場でCパーツの需要を牽引する可能性のあるもう1つの主要な要因です。さらに、航空機の改造と車両の電動化の需要も、今後数年間でCパーツの成長をサポートする可能性があります。

アビオニクス、EFB、ADAS、その他のタイプの電子機器およびディスプレイ システムなどのコンポーネントの導入に対する需要は、航空宇宙および自動車部門全体で C パーツのニーズをさらに生み出しています。

さらに、電気自動車の採用の増加により、新しいカテゴリの顧客に対応する自動車業界の新しいセグメントが生まれました。電気自動車の設計/製造により、電子部品の統合の必要性も生まれ、車両のセンサーの磁気障害を回避するためにプラスチック/複合ファスナーとアルミニウム ファスナーの使用が増加しています。

製品タイプに基づいて、アジア太平洋の C パーツ市場は、ファスナー、ベアリング、その他に分類されます。ファスナーセグメントは、ナット、ボルト、ネジ、ワッシャー、その他にさらに細分化されています。ファスナーセグメントは、2023年にアジア太平洋地域のCパーツ市場で最大のシェアを占めました。

ベアリングは、アジア太平洋地域のCパーツ市場における主要コンポーネントの1つであり、機械を使用するあらゆる業界で使用されています。ベアリングは、シャフトまたは関連構造間の動力の移行をスムーズにすることで、回転運動をサポートします。ベアリングには、主にボールベアリングとローラーベアリングの2種類があります。さらに、ボールベアリングは、金属ボールを利用して回転摩擦を低減し、ラジアル荷重と軸方向荷重をサポートします。ボールベアリングには、主に深溝玉軸受、アンギュラコンタクト玉軸受、自動調心玉軸受、スラスト玉軸受の4種類があります。

その他セグメントは、壁プラグ、シム、ケーブルタイで構成されています。プラグは主に壁にネジを穴あけするときに使用されます。プラグは、壁構造にネジを取り付けるために使用されるプラスチック製のインサートで、壁のネジだけでは支えられない他の構造の重量を支えるために使用されます。シムは、異なる表面間の小さな隙間を埋めるために使用される薄い金属片です。ケーブルタイは、ザップストラップ、ワイヤタイ、またはジップタイとも呼ばれ、ワイヤをまとめるために使用されます。ケーブルタイは、さまざまなレベルのワイヤとケーブルを整理するために使用されます。ケーブルタイの主な用途には、車両、航空機、ヘリコプター、電子機器、産業機器、電子機器などがあります。

1.           Introduction

1.1       The Insight Partners Research Report Guidance

1.2       Market Segmentation

2.           Executive Summary

2.1       Key Insights

2.2       Market Attractiveness

3.           Research Methodology

3.1       Secondary Research

3.2       Primary Research

3.2.1         Hypothesis formulation:

3.2.2         Macro-economic factor analysis:

3.2.3         Developing base number:

3.2.4         Data Triangulation:

3.2.5         Country level data:

4.           Asia Pacific C-Parts Market Landscape

4.1       Overview

4.2       PEST Analysis

4.3       Ecosystem Analysis

4.3.1         Raw Material Suppliers

4.3.2         C-Parts Manufacturers

4.3.3         End Users

4.3.4         List of Vendors in the Value Chain

5.           Asia Pacific C-Parts Market – Key Market Dynamics

5.1       Asia Pacific C-Parts Market – Key Market Dynamics

5.2       Market Drivers

5.2.1         Rise in Orders and Deliveries of Aircraft Worldwide

5.2.2         Surge in Automotive Production Across Asia Pacific Countries

5.3       Market Restraints

5.3.1         Suspended Production of B737 Max Program and Discontinuation of A380s and B747 Jumbo Jets

5.3.2         Increasing Use of Composite Parts in Various Industries

5.4       Market Opportunities

5.4.1         Growing Global Aircraft Fleet Size

5.5       Future Trends

5.5.1         Increasing Integration of Electronic Components in Aircraft and Automobiles

5.6       Impact of Drivers and Restraints:

6.           Asia Pacific C-Parts Market Analysis

6.1       Asia Pacific C-Parts Market Revenue (US$ Billion), 2021–2031

6.2       Asia Pacific C-Parts Market Forecast and Analysis

7.           Asia Pacific C-Parts Market Analysis – by Product Type

7.1       Fasteners

7.1.1         Overview

7.1.2         Fasteners: Asia Pacific C-Parts Market – Revenue and Forecast to 2031 (US$ Billion)

7.1.3         Fasteners Market, by Type

7.2       Bearings

7.2.1         Overview

7.2.2         Bearings: Asia Pacific C-Parts Market – Revenue and Forecast to 2031 (US$ Billion)

7.3       Others

7.3.1         Overview

7.3.2         Others: Asia Pacific C-Parts Market – Revenue and Forecast to 2031 (US$ Billion)

8.           Asia Pacific C-Parts Market Analysis – by End-use Industry

8.1       Automotive

8.1.1         Overview

8.1.2         Automotive: Asia Pacific C-Parts Market – Revenue and Forecast to 2031 (US$ Billion)

8.2       Aerospace and Defense

8.2.1         Overview

8.2.2         Aerospace and Defense: Asia Pacific C-Parts Market – Revenue and Forecast to 2031 (US$ Billion)

8.3       Energy and Power

8.3.1         Overview

8.3.2         Energy and Power: Asia Pacific C-Parts Market – Revenue and Forecast to 2031 (US$ Billion)

8.4       Semiconductors

8.4.1         Overview

8.4.2         Semiconductors: Asia Pacific C-Parts Market – Revenue and Forecast to 2031 (US$ Billion)

8.5       Others

8.5.1         Overview

8.5.2         Others: Asia Pacific C-Parts Market – Revenue and Forecast to 2031 (US$ Billion)

9.           Asia Pacific C-Parts Market Analysis – by Material Type

9.1       Steel/Stainless Steel

9.1.1         Overview

9.1.2         Steel/Stainless Steel: Asia Pacific C-Parts Market – Revenue and Forecast to 2031 (US$ Billion)

9.2       Plastic/Composites

9.2.1         Overview

9.2.2         Plastic/Composites: Asia Pacific C-Parts Market – Revenue and Forecast to 2031 (US$ Billion)

9.3       Cast Iron

9.3.1         Overview

9.3.2         Cast Iron: Asia Pacific C-Parts Market – Revenue and Forecast to 2031 (US$ Billion)

9.4       Steel Alloys

9.4.1         Overview

9.4.2         Steel Alloys: Asia Pacific C-Parts Market – Revenue and Forecast to 2031 (US$ Billion)

9.5       Others

9.5.1         Overview

9.5.2         Others: Asia Pacific C-Parts Market – Revenue and Forecast to 2031 (US$ Billion)

10.        Asia Pacific C-Parts Market – Country Analysis

10.1     Asia Pacific

10.1.1       Asia Pacific C-Parts Market Breakdown by Countries

10.1.2       Asia Pacific C-Parts Market Revenue and Forecast and Analysis – by Country

10.1.2.1          Asia Pacific C-Parts Market Revenue and Forecast and Analysis – by Country

10.1.2.2          Australia: Asia Pacific C-Parts Market – Revenue and Forecast to 2031 (US$ Billion)

10.1.2.2.1        Australia: Asia Pacific C-Parts Market Breakdown by Product Type

10.1.2.2.1.1      Australia: Asia Pacific C-Parts Market Breakdown by Fasteners

10.1.2.2.2        Australia: Asia Pacific C-Parts Market Breakdown by End-use Industry

10.1.2.2.3        Australia: Asia Pacific C-Parts Market Breakdown by Material Type

10.1.2.3          China: Asia Pacific C-Parts Market – Revenue and Forecast to 2031 (US$ Billion)

10.1.2.3.1        China: Asia Pacific C-Parts Market Breakdown by Product Type

10.1.2.3.1.1      China: Asia Pacific C-Parts Market Breakdown by Fasteners

10.1.2.3.2        China: Asia Pacific C-Parts Market Breakdown by End-use Industry

10.1.2.3.3        China: Asia Pacific C-Parts Market Breakdown by Material Type

10.1.2.4          India: Asia Pacific C-Parts Market – Revenue and Forecast to 2031 (US$ Billion)

10.1.2.4.1        India: Asia Pacific C-Parts Market Breakdown by Product Type

10.1.2.4.1.1      India: Asia Pacific C-Parts Market Breakdown by Fasteners

10.1.2.4.2        India: Asia Pacific C-Parts Market Breakdown by End-use Industry

10.1.2.4.3        India: Asia Pacific C-Parts Market Breakdown by Material Type

10.1.2.5          Japan: Asia Pacific C-Parts Market – Revenue and Forecast to 2031 (US$ Billion)

10.1.2.5.1        Japan: Asia Pacific C-Parts Market Breakdown by Product Type

10.1.2.5.1.1      Japan: Asia Pacific C-Parts Market Breakdown by Fasteners

10.1.2.5.2        Japan: Asia Pacific C-Parts Market Breakdown by End-use Industry

10.1.2.5.3        Japan: Asia Pacific C-Parts Market Breakdown by Material Type

10.1.2.6          South Korea: Asia Pacific C-Parts Market – Revenue and Forecast to 2031 (US$ Billion)

10.1.2.6.1        South Korea: Asia Pacific C-Parts Market Breakdown by Product Type

10.1.2.6.1.1      South Korea: Asia Pacific C-Parts Market Breakdown by Fasteners

10.1.2.6.2        South Korea: Asia Pacific C-Parts Market Breakdown by End-use Industry

10.1.2.6.3        South Korea: Asia Pacific C-Parts Market Breakdown by Material Type

10.1.2.7          Singapore: Asia Pacific C-Parts Market – Revenue and Forecast to 2031 (US$ Billion)

10.1.2.7.1        Singapore: Asia Pacific C-Parts Market Breakdown by Product Type

10.1.2.7.1.1      Singapore: Asia Pacific C-Parts Market Breakdown by Fasteners

10.1.2.7.2        Singapore: Asia Pacific C-Parts Market Breakdown by End-use Industry

10.1.2.7.3        Singapore: Asia Pacific C-Parts Market Breakdown by Material Type

10.1.2.8          Thailand: Asia Pacific C-Parts Market – Revenue and Forecast to 2031 (US$ Billion)

10.1.2.8.1        Thailand: Asia Pacific C-Parts Market Breakdown by Product Type

10.1.2.8.1.1      Thailand: Asia Pacific C-Parts Market Breakdown by Fasteners

10.1.2.8.2        Thailand: Asia Pacific C-Parts Market Breakdown by End-use Industry

10.1.2.8.3        Thailand: Asia Pacific C-Parts Market Breakdown by Material Type

10.1.2.9          Vietnam: Asia Pacific C-Parts Market – Revenue and Forecast to 2031 (US$ Billion)

10.1.2.9.1        Vietnam: Asia Pacific C-Parts Market Breakdown by Product Type

10.1.2.9.1.1      Vietnam: Asia Pacific C-Parts Market Breakdown by Fasteners

10.1.2.9.2        Vietnam: Asia Pacific C-Parts Market Breakdown by End-use Industry

10.1.2.9.3        Vietnam: Asia Pacific C-Parts Market Breakdown by Material Type

10.1.2.10       Indonesia: Asia Pacific C-Parts Market – Revenue and Forecast to 2031 (US$ Billion)

10.1.2.10.1     Indonesia: Asia Pacific C-Parts Market Breakdown by Product Type

10.1.2.10.1.1    Indonesia: Asia Pacific C-Parts Market Breakdown by Fasteners

10.1.2.10.2     Indonesia: Asia Pacific C-Parts Market Breakdown by End-use Industry

10.1.2.10.3     Indonesia: Asia Pacific C-Parts Market Breakdown by Material Type

10.1.2.11       Rest of APAC: Asia Pacific C-Parts Market – Revenue and Forecast to 2031 (US$ Billion)

10.1.2.11.1     Rest of APAC: Asia Pacific C-Parts Market Breakdown by Product Type

10.1.2.11.1.1    Rest of APAC: Asia Pacific C-Parts Market Breakdown by Fasteners

10.1.2.11.2     Rest of APAC: Asia Pacific C-Parts Market Breakdown by End-use Industry

10.1.2.11.3     Rest of APAC: Asia Pacific C-Parts Market Breakdown by Material Type

11.        Competitive Landscape

11.1     Heat Map Analysis by Key Players

11.2     Company Positioning & Concentration

12.        Industry Landscape

12.1     Overview

12.2     Market Initiative

12.3     Product Development

12.4     Mergers & Acquisitions

13.        Company Profiles

13.1     Fastenal Co

13.1.1       Key Facts

13.1.2       Business Description

13.1.3       Products and Services

13.1.4       Financial Overview

13.1.5       SWOT Analysis

13.1.6       Key Developments

13.2     W W Grainger Inc

13.2.1       Key Facts

13.2.2       Business Description

13.2.3       Products and Services

13.2.4       Financial Overview

13.2.5       SWOT Analysis

13.2.6       Key Developments

13.3     ERIKS

13.3.1       Key Facts

13.3.2       Business Description

13.3.3       Products and Services

13.3.4       Financial Overview

13.3.5       SWOT Analysis

13.3.6       Key Developments

13.4     RS Group Plc

13.4.1       Key Facts

13.4.2       Business Description

13.4.3       Products and Services

13.4.4       Financial Overview

13.4.5       SWOT Analysis

13.4.6       Key Developments

13.5     Kaman Corp

13.5.1       Key Facts

13.5.2       Business Description

13.5.3       Products and Services

13.5.4       Financial Overview

13.5.5       SWOT Analysis

13.5.6       Key Developments

13.6     Würth Industrie Service GmbH & Co. KG

13.6.1       Key Facts

13.6.2       Business Description

13.6.3       Products and Services

13.6.4       Financial Overview

13.6.5       SWOT Analysis

13.6.6       Key Developments

13.7     Ningbo yi pian hong fastener Co., Ltd

13.7.1       Key Facts

13.7.2       Business Description

13.7.3       Products and Services

13.7.4       Financial Overview

13.7.5       SWOT Analysis

13.7.6       Key Developments

13.8     Bossard Holding AG

13.8.1       Key Facts

13.8.2       Business Description

13.8.3       Products and Services

13.8.4       Financial Overview

13.8.5       SWOT Analysis

13.8.6       Key Developments

13.9     MCMASTER-CARR

13.9.1       Key Facts

13.9.2       Business Description

13.9.3       Products and Services

13.9.4       Financial Overview

13.9.5       SWOT Analysis

13.9.6       Key Developments

13.10  Fabory Nederland B.V.

13.10.1    Key Facts

13.10.2    Business Description

13.10.3    Products and Services

13.10.4    Financial Overview

13.10.5    SWOT Analysis

13.10.6    Key Developments

13.11  Bailey International LLC

13.11.1    Key Facts

13.11.2    Business Description

13.11.3    Products and Services

13.11.4    Financial Overview

13.11.5    SWOT Analysis

13.11.6    Key Developments

13.12  Exim & Mfr Enterprise

13.12.1    Key Facts

13.12.2    Business Description

13.12.3    Products and Services

13.12.4    Financial Overview

13.12.5    SWOT Analysis

13.12.6    Key Developments

14.        Appendix

14.1     About The Insight Partners


List of Tables

Table 1.             Asia Pacific C-Parts Market Segmentation

Table 2.             List of Vendors

Table 3.             Asia Pacific C-Parts Market – Revenue and Forecast to 2031 (US$ Billion)

Table 4.             Asia Pacific C-Parts Market – Revenue and Forecast to 2031 (US$ Billion) – by Product Type

Table 5.             Asia Pacific C-Parts Market, by Fastener Type – Revenue and Forecast to 2031 (USD Million)

Table 6.             Asia Pacific C-Parts Market – Revenue and Forecast to 2031 (US$ Billion) – by End-use Industry

Table 7.             Asia Pacific C-Parts Market – Revenue and Forecast to 2031 (US$ Billion) – by Material Type

Table 8.             Asia Pacific C-Parts Market – Revenue and Forecast to 2031 (US$ Billion) – by Country

Table 9.             Australia: Asia Pacific C-Parts Market – Revenue and Forecast to 2031 (US$ Billion) – by Product Type

Table 10.          Australia: Asia Pacific C-Parts Market – Revenue and Forecast to 2031 (US$ Billion) – by Fasteners

Table 11.          Australia: Asia Pacific C-Parts Market – Revenue and Forecast to 2031 (US$ Billion) – by End-use Industry

Table 12.          Australia: Asia Pacific C-Parts Market – Revenue and Forecast to 2031 (US$ Billion) – by Material Type

Table 13.          China: Asia Pacific C-Parts Market – Revenue and Forecast to 2031 (US$ Billion) – by Product Type

Table 14.          China: Asia Pacific C-Parts Market – Revenue and Forecast to 2031 (US$ Billion) – by Fasteners

Table 15.          China: Asia Pacific C-Parts Market – Revenue and Forecast to 2031 (US$ Billion) – by End-use Industry

Table 16.          China: Asia Pacific C-Parts Market – Revenue and Forecast to 2031 (US$ Billion) – by Material Type

Table 17.          India: Asia Pacific C-Parts Market – Revenue and Forecast to 2031 (US$ Billion) – by Product Type

Table 18.          India: Asia Pacific C-Parts Market – Revenue and Forecast to 2031 (US$ Billion) – by Fasteners

Table 19.          India: Asia Pacific C-Parts Market – Revenue and Forecast to 2031 (US$ Billion) – by End-use Industry

Table 20.          India: Asia Pacific C-Parts Market – Revenue and Forecast to 2031 (US$ Billion) – by Material Type

Table 21.          Japan: Asia Pacific C-Parts Market – Revenue and Forecast to 2031 (US$ Billion) – by Product Type

Table 22.          Japan: Asia Pacific C-Parts Market – Revenue and Forecast to 2031 (US$ Billion) – by Fasteners

Table 23.          Japan: Asia Pacific C-Parts Market – Revenue and Forecast to 2031 (US$ Billion) – by End-use Industry

Table 24.          Japan: Asia Pacific C-Parts Market – Revenue and Forecast to 2031 (US$ Billion) – by Material Type

Table 25.          South Korea: Asia Pacific C-Parts Market – Revenue and Forecast to 2031 (US$ Billion) – by Product Type

Table 26.          South Korea: Asia Pacific C-Parts Market – Revenue and Forecast to 2031 (US$ Billion) – by Fasteners

Table 27.          South Korea: Asia Pacific C-Parts Market – Revenue and Forecast to 2031 (US$ Billion) – by End-use Industry

Table 28.          South Korea: Asia Pacific C-Parts Market – Revenue and Forecast to 2031 (US$ Billion) – by Material Type

Table 29.          Singapore: Asia Pacific C-Parts Market – Revenue and Forecast to 2031 (US$ Billion) – by Product Type

Table 30.          Singapore: Asia Pacific C-Parts Market – Revenue and Forecast to 2031 (US$ Billion) – by Fasteners

Table 31.          Singapore: Asia Pacific C-Parts Market – Revenue and Forecast to 2031 (US$ Billion) – by End-use Industry

Table 32.          Singapore: Asia Pacific C-Parts Market – Revenue and Forecast to 2031 (US$ Billion) – by Material Type

Table 33.          Thailand: Asia Pacific C-Parts Market – Revenue and Forecast to 2031 (US$ Billion) – by Product Type

Table 34.          Thailand: Asia Pacific C-Parts Market – Revenue and Forecast to 2031 (US$ Billion) – by Fasteners

Table 35.          Thailand: Asia Pacific C-Parts Market – Revenue and Forecast to 2031 (US$ Billion) – by End-use Industry

Table 36.          Thailand: Asia Pacific C-Parts Market – Revenue and Forecast to 2031 (US$ Billion) – by Material Type

Table 37.          Vietnam: Asia Pacific C-Parts Market – Revenue and Forecast to 2031 (US$ Billion) – by Product Type

Table 38.          Vietnam: Asia Pacific C-Parts Market – Revenue and Forecast to 2031 (US$ Billion) – by Fasteners

Table 39.          Vietnam: Asia Pacific C-Parts Market – Revenue and Forecast to 2031 (US$ Billion) – by End-use Industry

Table 40.          Vietnam: Asia Pacific C-Parts Market – Revenue and Forecast to 2031 (US$ Billion) – by Material Type

Table 41.          Indonesia: Asia Pacific C-Parts Market – Revenue and Forecast to 2031 (US$ Billion) – by Product Type

Table 42.          Indonesia: Asia Pacific C-Parts Market – Revenue and Forecast to 2031 (US$ Billion) – by Fasteners

Table 43.          Indonesia: Asia Pacific C-Parts Market – Revenue and Forecast to 2031 (US$ Billion) – by End-use Industry

Table 44.          Indonesia: Asia Pacific C-Parts Market – Revenue and Forecast to 2031 (US$ Billion) – by Material Type

Table 45.          Rest of APAC: Asia Pacific C-Parts Market – Revenue and Forecast to 2031 (US$ Billion) – by Product Type

Table 46.          Rest of APAC: Asia Pacific C-Parts Market – Revenue and Forecast to 2031 (US$ Billion) – by Fasteners

Table 47.          Rest of APAC: Asia Pacific C-Parts Market – Revenue and Forecast to 2031 (US$ Billion) – by End-use Industry

Table 48.          Rest of APAC: Asia Pacific C-Parts Market – Revenue and Forecast to 2031 (US$ Billion) – by Material Type


List of Figures

Figure 1.           Asia Pacific C-Parts Market Segmentation, by Country

Figure 2.           PEST Analysis

Figure 3.           Impact Analysis of Drivers and Restraints

Figure 4.           Asia Pacific C-Parts Market Revenue (US$ Billion), 2021–2031

Figure 5.           Asia Pacific C-Parts Market Share (%) – by Product Type, 2023 and 2031

Figure 6.           Fasteners: Asia Pacific C-Parts Market – Revenue and Forecast to 2031 (US$ Billion)

Figure 7.           Bearings: Asia Pacific C-Parts Market – Revenue and Forecast to 2031 (US$ Billion)

Figure 8.           Others: Asia Pacific C-Parts Market – Revenue and Forecast to 2031 (US$ Billion)

Figure 9.           Asia Pacific C-Parts Market Share (%) – by End-use Industry, 2023 and 2031

Figure 10.        Automotive: Asia Pacific C-Parts Market – Revenue and Forecast to 2031 (US$ Billion)

Figure 11.        Aerospace and Defense: Asia Pacific C-Parts Market – Revenue and Forecast to 2031 (US$ Billion)

Figure 12.        Energy and Power: Asia Pacific C-Parts Market – Revenue and Forecast to 2031 (US$ Billion)

Figure 13.        Semiconductors: Asia Pacific C-Parts Market – Revenue and Forecast to 2031 (US$ Billion)

Figure 14.        Others: Asia Pacific C-Parts Market – Revenue and Forecast to 2031 (US$ Billion)

Figure 15.        Asia Pacific C-Parts Market Share (%) – by Material Type, 2023 and 2031

Figure 16.        Steel/Stainless Steel: Asia Pacific C-Parts Market – Revenue and Forecast to 2031 (US$ Billion)

Figure 17.        Plastic/Composites: Asia Pacific C-Parts Market – Revenue and Forecast to 2031 (US$ Billion)

Figure 18.        Cast Iron: Asia Pacific C-Parts Market – Revenue and Forecast to 2031 (US$ Billion)

Figure 19.        Steel Alloys: Asia Pacific C-Parts Market – Revenue and Forecast to 2031 (US$ Billion)

Figure 20.        Others: Asia Pacific C-Parts Market – Revenue and Forecast to 2031 (US$ Billion)

Figure 21.        Asia Pacific C-Parts Market Breakdown by Key Countries, 2023 and 2031 (%)

Figure 22.        Australia: Asia Pacific C-Parts Market – Revenue and Forecast to 2031 (US$ Billion)

Figure 23.        China: Asia Pacific C-Parts Market – Revenue and Forecast to 2031 (US$ Billion)

Figure 24.        India: Asia Pacific C-Parts Market – Revenue and Forecast to 2031 (US$ Billion)

Figure 25.        Japan: Asia Pacific C-Parts Market – Revenue and Forecast to 2031 (US$ Billion)

Figure 26.        South Korea: Asia Pacific C-Parts Market – Revenue and Forecast to 2031 (US$ Billion)

Figure 27.        Singapore: Asia Pacific C-Parts Market – Revenue and Forecast to 2031 (US$ Billion)

Figure 28.        Thailand: Asia Pacific C-Parts Market – Revenue and Forecast to 2031 (US$ Billion)

Figure 29.        Vietnam: Asia Pacific C-Parts Market – Revenue and Forecast to 2031 (US$ Billion)

Figure 30.        Indonesia: Asia Pacific C-Parts Market – Revenue and Forecast to 2031 (US$ Billion)

Figure 31.        Rest of APAC: Asia Pacific C-Parts Market – Revenue and Forecast to 2031 (US$ Billion)

Figure 32.        Heat Map Analysis by Key Players

Figure 33.        Company Positioning & Concentration

  • Fastenal Co
  • W W Grainger Inc
  • ERIKS
  • RS Group Plc
  • Kaman Group
  • Würth Industrie Service GmbH & Co. KG
  • Ningbo yi pian hong fastener Co., Ltd
  • Bossard Holding AG
  • MCMASTER-CARR
  • Fabory Nederland B.V.
  • Save and reduce time carrying out entrylevel research by identifying the growth, size, leading players, and segments in the aerial firefighting market.
  •  Highlights key business priorities in order to assist companies to realign their business strategies
  •  The key findings and recommendations highlight crucial progressive industry trends in the aerial firefighting market, thereby allowing players across the value chain to develop effective longterm strategies
  •  Develop/modify business expansion plans by using substantial growth offering developed and emerging markets
  •  Scrutinize indepth global market trends and outlook coupled with the factors driving the market, as well as those hindering it
  •  Enhance the decisionmaking process by understanding the strategies that underpin commercial interest with respect to client products, segmentation, pricing and distribution
Report Code
Full Name
Country Name
Email Id
Phone Number
Job Title
Company
Requirement

Note : Your data will never be shared with third parties, however, we may send you information from time to time about our products that may be of interest to you. By submitting your details, you agree to be contacted by us. You may contact us at any time to opt-out.


Purchase Options
Single User License
$3550
$2485
Site License
$4550
$3185
Enterprise License
$5550
$3885