Analysis By Technology (Augmented Reality and Virtual Reality), Component (Semiconductor Components, Sensors, and Others), and End-User Industry (Entertainment, Educational, Industrial, Medical, Real Estate & Architecture, Retail, Aerospace & Defense, and Others)
No. of Pages:125
Report Code:
BMIRE00025060
Category:
Electronics and Semiconductor
Asia Pacific Augmented Reality and Virtual Reality Market
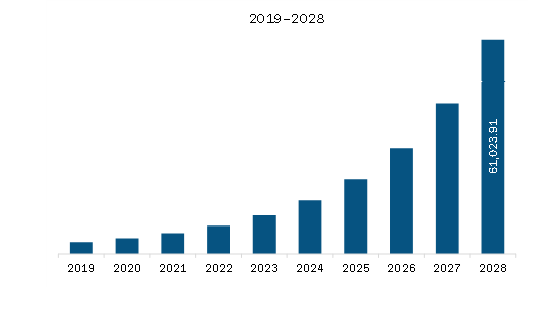
The augmented reality and virtual reality market in Asia-Pacific is expected to grow from US$ 5,918.74 million in 2021 to US$ 61,023.91 million by 2028; it is estimated to register a CAGR of 39.6% from 2021 to 2028.
Customer support departments have improved significantly due to advancements in AI-powered chatbots and virtual assistants. However, chatbots experience difficulties with remote troubleshooting, which is a major challenge the customer care team faces. The integration of virtual reality in customer service has been critical for retailers in consumer engagement and consumer satisfaction. Moreover, fundamental and challenging issues can be resolved in less time using this technology after ending the communication between customers and customer care departments. Implementing excellent customer service initiatives for profitable businesses shows customers respect and loyalty. The retail sector is incorporating virtual reality, the most advanced technology that creates an immersive experience with a powerful sensory effect and a strong emotional connection. Companies use this connection to engage with customers in new and relevant ways. When emotionally connected with a brand, customers are likely to repeat purchases and become brand loyalists. Furthermore, virtual reality provides a highly realistic level of customer experience. Marketers can create different VR ads to display products in new ways. Thus, the rising use of virtual reality solutions across retail stores is driving the augmented reality and virtual reality market growth.
Asia-Pacific Augmented Reality and Virtual Reality Market Revenue and Forecast to 2028 (US$ Million)
Asia-Pacific Augmented Reality and Virtual Reality Market Segmentation
The Asia-Pacific augmented reality and virtual reality market is segmented into technology, component, end-user industry, and country. Based on technology, the market is bifurcated into augmented reality and virtual reality. In 2020, the augmented reality segment held the largest share of the Asia-Pacific augmented reality and virtual reality market. Based on components, the market is segmented into sensors, semiconductor components, and others. In 2020, the semiconductor components segment held the largest share of the Asia-Pacific augmented reality and virtual reality market. Based on end-user industry, the market is segmented into entertainment, educational, industrial, medical, real estate & architecture, retail, aerospace & defense, and others. In 2020, the entertainment segment held the largest share of the Asia-Pacific augmented reality and virtual reality market. Similarly, based on country, the Asia-Pacific augmented reality and virtual reality market is segmented into China, Japan, India, Australia, South Korea, and the Rest of Asia-Pacific. China held a substantial share of the market in 2020. EON Reality, Google LLC, Immersive Gaze, Simulanis Solutions Private Limited, Vuzix Corporation, and YeppAR are among the leading companies in the Asia-Pacific augmented reality and virtual reality market.
Asia Pacific Augmented Reality and Virtual Reality Market Strategic Insights
Get more information on this report
Asia Pacific Augmented Reality and Virtual Reality Market Segmentation Analysis
Asia Pacific Augmented Reality and Virtual Reality Market Report Highlights
Asia Pacific Augmented Reality and Virtual Reality Report Scope
Report Attribute
Details
Market size in 2021
US$ 5,918.74 Million
Market Size by 2028
US$ 61,023.91 Million
CAGR (2021 - 2028)
39.6%
Historical Data
2019-2020
Forecast period
2022-2028
Segments Covered
By Technology
Augmented Reality
Virtual Reality
By Component
Semiconductor Components
Sensors
By End-user Industry
Entertainment
Educational
Industrial
Medical
Real Estate & Architecture
Retail
Aerospace & Defense
Regions and Countries Covered
Asia-Pacific
China, India, Japan, Australia, Rest of Asia-Pacific
Market leaders and key company profiles
EON Reality
Google LLC
Immersive Gaze
Simulanis Solutions Private Limited
Vuzix Corporation
YeppAR
Get more information on this report
Asia Pacific Augmented Reality and Virtual Reality Market Country and Regional Insights
Get more information on this report
Identical Market Reports with other Region/Countries
The List of Companies - Asia Pacific Augmented Reality and Virtual Reality Market
EON RealityGoogle LLCImmersive GazeSimulanis Solutions Private LimitedVuzix CorporationYeppAR
Frequently Asked Questions
How big is the Asia Pacific Augmented Reality and Virtual Reality Market?
The Asia Pacific Augmented Reality and Virtual Reality Market is valued at US$ 5,918.74 Million in 2021, it is projected to reach US$ 61,023.91 Million by 2028.
What is the CAGR for Asia Pacific Augmented Reality and Virtual Reality Market by (2021 - 2028)?
As per our report Asia Pacific Augmented Reality and Virtual Reality Market, the market size is valued at US$ 5,918.74 Million in 2021, projecting it to reach US$ 61,023.91 Million by 2028. This translates to a CAGR of approximately 39.6% during the forecast period.
What segments are covered in this report?
The Asia Pacific Augmented Reality and Virtual Reality Market report typically cover these key segments-
Technology (Augmented Reality, Virtual Reality)
Component (Semiconductor Components, Sensors)
End-user Industry (Entertainment, Educational, Industrial, Medical, Real Estate & Architecture, Retail, Aerospace & Defense)
What is the historic period, base year, and forecast period taken for Asia Pacific Augmented Reality and Virtual Reality Market?
The historic period, base year, and forecast period can vary slightly depending on the specific market research report. However, for the Asia Pacific Augmented Reality and Virtual Reality Market report:
Historic Period : 2019-2020
Base Year : 2021
Forecast Period : 2022-2028
Who are the major players in Asia Pacific Augmented Reality and Virtual Reality Market?
The Asia Pacific Augmented Reality and Virtual Reality Market is populated by several key players, each contributing to its growth and innovation. Some of the major players include:
EON Reality
Google LLC
Immersive Gaze
Simulanis Solutions Private Limited
Vuzix Corporation
YeppAR
Who should buy this report?
The Asia Pacific Augmented Reality and Virtual Reality Market report is valuable for diverse stakeholders, including:
Investors: Provides insights for investment decisions pertaining to market growth, companies, or industry insights. Helps assess market attractiveness and potential returns.
Industry Players: Offers competitive intelligence, market sizing, and trend analysis to inform strategic planning, product development, and sales strategies.
Suppliers and Manufacturers: Helps understand market demand for components, materials, and services related to concerned industry.
Researchers and Consultants: Provides data and analysis for academic research, consulting projects, and market studies.
Financial Institutions: Helps assess risks and opportunities associated with financing or investing in the concerned market.
Essentially, anyone involved in or considering involvement in the Asia Pacific Augmented Reality and Virtual Reality Market value chain can benefit from the information contained in a comprehensive market report.


 Get Free Sample For Asia Pacific Augmented Reality and Virtual Reality Market


