Previsioni di mercato dello yogurt non caseario per l\'America del Sud e Centro fino al 2030 - Analisi regionale - per fonte (mandorle, soia, cocco, avena e altri), tipologia (aromatizzato e semplice), natura (biologico e convenzionale) e canale di distribuzione (supermercati) e ipermercati, minimarket, vendita al dettaglio online e altri)
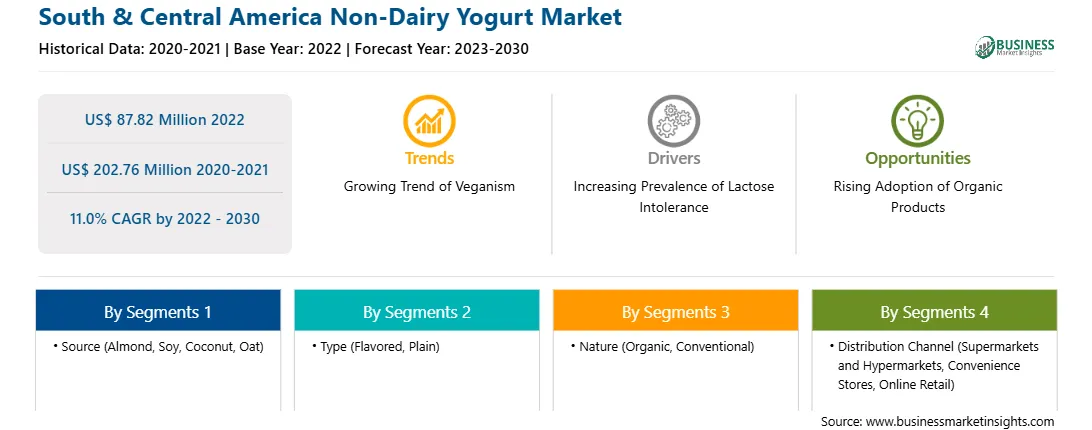
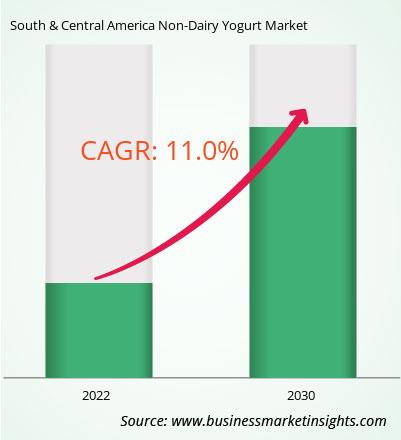
Il mercato dello yogurt non caseario in Sud e Centro America è stato valutato a 87,82 milioni di dollari nel 2022 e si prevede che raggiungerà i 202,76 milioni di dollari entro il 2030; si stima che crescerà a un CAGR dell\'11,0% dal 2022 al 2030.
La tendenza crescente del veganismo a causa della crescente preoccupazione ambientale alimenta il mercato dello yogurt non caseario in America Centrale e Meridionale.
Il vegano La popolazione è cresciuta notevolmente negli ultimi anni. Secondo Veganuary (un’organizzazione no-profit che incoraggia le persone di tutto il mondo a diventare vegane per l’intero mese di gennaio), nel 2022, più di 620.000 persone si sono iscritte alla campagna Veganuary, e le registrazioni sono aumentate del 200% negli ultimi tre anni.
La figura seguente mostra il numero di partecipanti nel mondo alla Campagna Veganuary dal 2016 al 2022:
FIGURA 1. REGISTRAZIONI ALLA CAMPAGNA VEGANUARY DAL 2016 AL 2022
Fonte : Revisione della campagna Veganuary 2022
L\'industria dell\'allevamento è uno dei fattori che contribuiscono in modo significativo alle emissioni totali di gas serra di origine antropica. Secondo l’Organizzazione per l’Alimentazione e l’Agricoltura (FAO), l’industria globale dell’allevamento emette 7,1 gigatonnellate di anidride carbonica all’anno, pari al 14,5% di tutte le emissioni di gas serra causate dall’uomo. Il settore lattiero-caseario è responsabile del 30% delle emissioni totali del bestiame.
La figura seguente mostra le emissioni annuali di gas serra per chilogrammo di prodotti alimentari:
FIGURA 2. EMISSIONI ANNUALI DI GAS SERRA (GHG) PER CHILOGRAMMO DI PRODOTTI ALIMENTARI
Fonte: Poore & Nemecek, 2018
Come si può vedere dalla figura sopra, la carne bovina (mandria da carne), la carne bovina (mandria da latte) e i prodotti a base di agnello e montone hanno le emissioni di gas serra più elevate. Molti studi hanno dimostrato che il passaggio a una dieta vegana può ridurre significativamente le emissioni di anidride carbonica. Inoltre, le Nazioni Unite, la PETA, il Good Food Institute e molte organizzazioni ritengono che il veganismo possa aiutare a salvare il pianeta dalla crisi climatica. La consapevolezza riguardo agli effetti dannosi dell’industria dell’allevamento sull’ambiente sta aumentando tra i consumatori. Il consumo di prodotti lattiero-caseari a base vegetale aiuta a ridurre al minimo l’impronta di carbonio, a risparmiare acqua e altre risorse naturali e a ridurre l’impatto ambientale complessivo. Pertanto, i consumatori stanno rapidamente passando ai latticini e ai prodotti a base di carne a base vegetale. Pertanto, le persone stanno passando sempre più a una dieta vegana a causa della crescente sostenibilità e delle preoccupazioni ambientali.
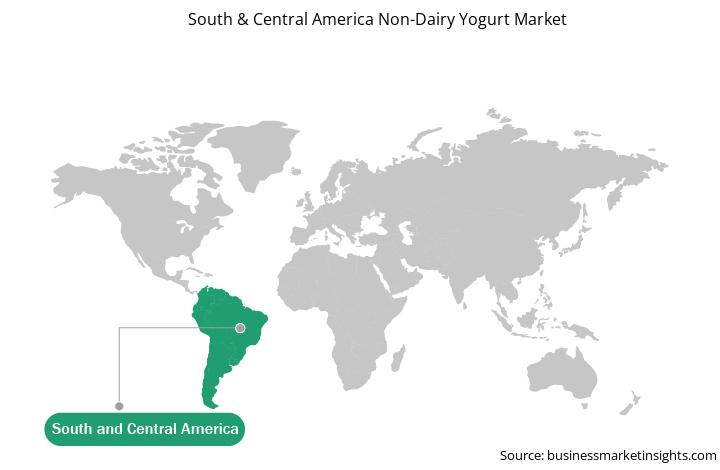
Panoramica del mercato dello yogurt non caseario nell\'America meridionale e centrale
Il mercato dello yogurt non caseario nell\'America meridionale e centrale è segmentato in Brasile, Argentina e nel resto dell\'America meridionale e centrale. Un cambiamento nello stile di vita dei consumatori e nei modelli alimentari è un fattore importante che guida la crescita del mercato dello yogurt vegetale nell’America meridionale e centrale, soprattutto in Brasile. L’aumento della popolazione e i continui miglioramenti tecnologici sono tra i fattori che stimolano la crescita economica di Brasile e Argentina. I latticini a base vegetale sono una buona fonte di energia e aiutano a ridurre il rischio di malattie cardiovascolari. Inoltre, la crescente allergia al latte, che provoca reazioni immunitarie avverse dopo il consumo di latte animale nella popolazione, in particolare bambini e neonati, è un fattore importante che guida la crescita del mercato.
L\'intolleranza al lattosio e il malassorbimento primario del lattosio sono i sintomi più comuni dell\'ipolattasia di tipo adulto (deficit di lattasi) in Argentina, Brasile ed Ecuador. Di conseguenza, i consumatori si stanno orientando verso prodotti senza latticini. Allergie e intolleranze sono le principali ragioni dietro lo spostamento verso prodotti senza latticini, soprattutto considerando le statistiche della Food Allergy Initiatives, che affermano che l’allergia al latte vaccino è la principale allergia alimentare sia nei neonati che negli adulti in Sud America. Questo fattore sta guidando principalmente la domanda di yogurt vegetale.
Entrate e previsioni del mercato dello yogurt non caseario per l\'America del Sud e Centro fino al 2030 (milioni di dollari)
Segmentazione del mercato dello yogurt non caseario dell\'America del Sud e Centro
Il mercato dello yogurt non caseario e Il mercato dello yogurt non caseario dell’America Centrale è segmentato in base alla fonte, al tipo, alla natura e al canale di distribuzione.
In base alla fonte, il mercato dello yogurt vegetale del Sud e Centro America è segmentato in mandorle, soia, cocco, avena e altri. Il segmento del cocco ha detenuto la quota maggiore nel 2022.
In base alla tipologia, il mercato dello yogurt non caseario dell\'America centrale e meridionale è suddiviso in aromatizzato e semplice. Il segmento aromatizzato ha detenuto una quota maggiore nel 2022.
In base alla natura, il mercato dello yogurt non caseario dell\'America meridionale e centrale è biforcato in biologico e convenzionale. Il segmento convenzionale deteneva una quota maggiore nel 2022.
In base al canale di distribuzione, il mercato dello yogurt non caseario dell\'America centrale e meridionale è segmentato in supermercati e ipermercati, minimarket, vendita al dettaglio online e altri. Il segmento dei supermercati e ipermercati ha detenuto la quota maggiore nel 2022.
In base al paese, il mercato dello yogurt non caseario dell\'America meridionale e centrale è classificato in Brasile, Argentina e Resto dell\'America meridionale e centrale. Il resto dell\'America meridionale e centrale ha dominato il mercato dello yogurt vegetale dell\'America meridionale e centrale nel 2022.
Danone SA, Cocojune Products, Forager Project, The Islandic Milk e Skyr Corporation sono alcune delle aziende leader che operano in il mercato dello yogurt vegetale del Sud e Centro America.
South & Central America Non-Dairy Yogurt Strategic Insights
Strategic insights for South & Central America Non-Dairy Yogurt involve closely monitoring industry trends, consumer behaviours, and competitor actions to identify opportunities for growth. By leveraging data analytics, businesses can anticipate market shifts and make informed decisions that align with evolving customer needs. Understanding these dynamics helps companies adjust their strategies proactively, enhance customer engagement, and strengthen their competitive edge. Building strong relationships with stakeholders and staying agile in response to changes ensures long-term success in any market.
Get more information on this report
South & Central America Non-Dairy Yogurt Report Scope
Report Attribute
Details
Market size in 2022
US$ 87.82 Million
Market Size by 2030
US$ 202.76 Million
Global CAGR (2022 - 2030)
11.0%
Historical Data
2020-2021
Forecast period
2023-2030
Segments Covered
By Fonte
mandorla
soia
cocco
avena
By Tipo
aromatizzato
semplice
By Natura
Biologico
Convenzionale
By Canale di distribuzione
supermercati e ipermercati
minimarket
vendita al dettaglio online
Regions and Countries Covered
America meridionale e centrale
Brasile
Argentina
resto delAmerica meridionale e centrale
Market leaders and key company profiles
Danone SA
Cocojune Products
Forager Project LLC
The Icelandic Milk and Skyr Corporation
Get more information on this report
South & Central America Non-Dairy Yogurt Regional Insights
The regional scope of South & Central America Non-Dairy Yogurt refers to the geographical area in which a business operates and competes. Understanding regional nuances, such as local consumer preferences, economic conditions, and regulatory environments, is crucial for tailoring strategies to specific markets. Businesses can expand their reach by identifying underserved regions or adapting their offerings to meet regional demands. A clear regional focus allows for more effective resource allocation, targeted marketing, and better positioning against local competitors, ultimately driving growth in those specific areas.
Get more information on this report
Identical Market Reports with other Region/Countries
The List of Companies - South & Central America Non-Dairy Yogurt Market
1. Danone SA 2. Cocojune Products 3. Forager Project LLC 4. The Icelandic Milk and Skyr Corporation
Frequently Asked Questions
How big is the South & Central America Non-Dairy Yogurt Market?
The South & Central America Non-Dairy Yogurt Market is valued at US$ 87.82 Million in 2022, it is projected to reach US$ 202.76 Million by 2030.
What is the CAGR for South & Central America Non-Dairy Yogurt Market by (2022 - 2030)?
As per our report South & Central America Non-Dairy Yogurt Market, the market size is valued at US$ 87.82 Million in 2022, projecting it to reach US$ 202.76 Million by 2030. This translates to a CAGR of approximately 11.0% during the forecast period.
What segments are covered in this report?
The South & Central America Non-Dairy Yogurt Market report typically cover these key segments-
Fonte (mandorla, soia, cocco, avena)
Tipo (aromatizzato, semplice)
Natura (Biologico, Convenzionale)
What is the historic period, base year, and forecast period taken for South & Central America Non-Dairy Yogurt Market?
The historic period, base year, and forecast period can vary slightly depending on the specific market research report. However, for the South & Central America Non-Dairy Yogurt Market report:
Historic Period : 2020-2021
Base Year : 2022
Forecast Period : 2023-2030
Who are the major players in South & Central America Non-Dairy Yogurt Market?
The South & Central America Non-Dairy Yogurt Market is populated by several key players, each contributing to its growth and innovation. Some of the major players include:
Danone SA
Cocojune Products
Forager Project LLC
The Icelandic Milk and Skyr Corporation
Who should buy this report?
The South & Central America Non-Dairy Yogurt Market report is valuable for diverse stakeholders, including:
Investors: Provides insights for investment decisions pertaining to market growth, companies, or industry insights. Helps assess market attractiveness and potential returns.
Industry Players: Offers competitive intelligence, market sizing, and trend analysis to inform strategic planning, product development, and sales strategies.
Suppliers and Manufacturers: Helps understand market demand for components, materials, and services related to concerned industry.
Researchers and Consultants: Provides data and analysis for academic research, consulting projects, and market studies.
Financial Institutions: Helps assess risks and opportunities associated with financing or investing in the concerned market.
Essentially, anyone involved in or considering involvement in the South & Central America Non-Dairy Yogurt Market value chain can benefit from the information contained in a comprehensive market report.
Get Free Sample For South & Central America Non-Dairy Yogurt Market
1. Complete the form
2. Check your inbox (and spam/junk folder)
3. Your Personal Data is Secure with us
GDPR + CCPA Compliant
Personal & transactional information is kept safe from unauthorized use.
WHAT'S INCLUDED IN FULL REPORT : Market Dynamics,
Competitive Analysis and Assessment, Define Business Strategies, Market Outlook and
Trends, Market Size and Share Analysis, Growth Driving Factors, Future Commercial
Potential, Identify Regional Growth Engines


 Get Free Sample For South & Central America Non-Dairy Yogurt Market

