Analysis - by Chemical Type (Lignin Sulfonate, Calcium Chloride, Magnesium Chloride, Asphalt Emulsions, Oil Emulsions, Polymeric Emulsions, and Others) and End-Use Industry (Mining, Construction, Oil and Gas, Food and Beverage, Textile, Glass and Ceramics, Pharmaceuticals, and Others)
No. of Pages:95
Report Code:
BMIRE00030250
Category:
Chemicals and Materials
Middle East & Africa Dust Control or Suppression Chemicals Market
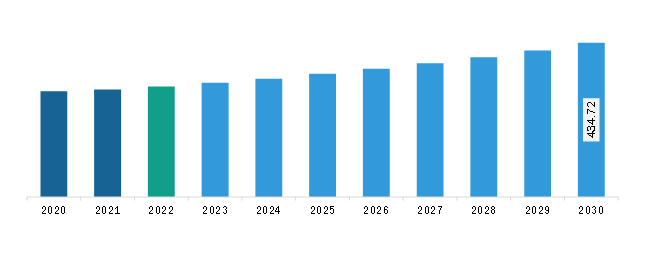
The Middle East & Africa dust control or suppression chemicals market was valued at US$ 312.06 million in 2022 and is expected to reach US$ 434.72 million by 2030; it is estimated to record a CAGR of 4.2% from 2022 to 2030.
Research Related to Bio-Based Dust Suppression Agents Bolsters Middle East & Africa Dust Control or Suppression Chemicals Market
Research and development related to innovative and bio-based dust suppressants is growing rapidly. Researchers and manufacturers are evaluating the environmental impact of dust control or suppression chemicals. Several studies are also being conducted to develop dust control solutions from biodegradable feedstock. This includes organic polymers, biodegradable surfactants, or plant-based compounds. In 2021, BioBlend Renewable Resources developed EPIC EL dust suppressant, funded by the United Soybean Board and the North Dakota Soybean Council. EPIC EL dust suppressant is a soy-based dust suppressant that contains glycerin, a co-product of biodiesel production.
Several government authorities also evaluate the effectiveness of bio-based dust suppression chemicals. The United States Army Engineer Research and Development Center (ERDC) evaluated green, non-corrosive, high-performing dust suppressant technologies for updating dust and field manuals used by the Army and Department of Defense. ERDC conducted a laboratory and field study to evaluate the effectiveness of bio-sourced dust suppressants based on their ability to mitigate dust. Therefore, research related to bio-based dust suppression agents is expected to drive the dust control or suppression chemicals market.
Middle East & Africa Dust Control or Suppression Chemicals Market Overview
The countries in the Middle East & Africa are rapidly developing their public infrastructure, including airports, hospitals, and administrative buildings. The construction of the commercial infrastructure sector in the region has upsurged due to the rising tourism industry and the growing immigrant population. Dust suppressant chemicals are used to minimize the air pollution caused in the construction industry.
The report published by the Minerals Council of South Africa in 2022 revealed that the mining production in South Africa was valued at US$ 57 billion in 2021 and reached US$ 61 billion in 2022. Further, in South Africa, mining exports accounted for US$ 46.3 billion, or 24% of the country's international trade in 2022. The World Mining Data 2022 report by the Federal Ministry of the Republic of Austria revealed that Africa accounted for 889,634,740 metric ton of mineral production (excluding bauxite). The mining production rate of minerals in Africa increased by 16.2% from 2000 to 2020. Thus, the rising mining production rate is expected to boost the demand for dust suppressant chemicals across the region.
Middle East & Africa Dust Control or Suppression Chemicals Market Revenue and Forecast to 2030 (US$ Million)
Middle East & Africa Dust Control or Suppression Chemicals Market Segmentation
The Middle East & Africa dust control or suppression chemicals market is segmented based on chemical type, end-use industry, and country. Based on chemical type, the Middle East & Africa dust control or suppression chemicals market is segmented into lignin sulfonate, calcium chloride, magnesium chloride, asphalt emulsions, oil emulsions, polymeric emulsions, and others. The calcium chloride segment held the largest market share in 2022.
In terms of end-use industry, the Middle East & Africa dust control or suppression chemicals market is categorized into mining, construction, oil and gas, food and beverage, textile, glass and ceramics, pharmaceuticals, and others. The mining segment held the largest market share in 2022.
Based on country, the Middle East & Africa dust control or suppression chemicals market is segmented into Saudi Arabia, South Africa, the UAE, and the Rest of Middle East & Africa. The Rest of Middle East & Africa dominated the Middle East & Africa dust control or suppression chemicals market share in 2022.
Veolia Environnement SA, Ecolab Inc, Quaker Chemical Corp, Dow Inc, BASF SE, and Solenis LLC are some of the leading players operating in the Middle East & Africa dust control or suppression chemicals market.
Middle East & Africa Dust Control or Suppression Chemicals Market Strategic Insights
Get more information on this report
Middle East & Africa Dust Control or Suppression Chemicals Market Segmentation Analysis
Middle East & Africa Dust Control or Suppression Chemicals Market Report Highlights
Middle East & Africa Dust Control or Suppression Chemicals Report Scope
Report Attribute
Details
Market size in 2022
US$ 312.06 Million
Market Size by 2030
US$ 434.72 Million
CAGR (2022 - 2030)
4.2%
Historical Data
2020-2021
Forecast period
2023-2030
Segments Covered
By Chemical Type
Lignin Sulfonate
Calcium Chloride
Magnesium Chloride
Asphalt Emulsions
Oil Emulsions
Polymeric Emulsions
By End-Use Industry
Mining
Construction
Oil and Gas
Food and Beverage
Textile
Glass and Ceramics
Pharmaceuticals
Regions and Countries Covered
Middle East and Africa
South Africa, Saudi Arabia, UAE, Rest of Middle East and Africa
Market leaders and key company profiles
Veolia Environnement SA
Ecolab Inc
Quaker Chemical Corp
Dow Inc
BASF SE
Solenis LLC
Get more information on this report
Middle East & Africa Dust Control or Suppression Chemicals Market Country and Regional Insights
Get more information on this report
Identical Market Reports with other Region/Countries
The List of Companies - Middle East & Africa Dust Control or Suppression Chemicals Market
1. Veolia Environnement SA2. Ecolab Inc3. Quaker Chemical Corp4. Dow Inc5. BASF SE6. Solenis LLC
Frequently Asked Questions
How big is the Middle East & Africa Dust Control or Suppression Chemicals Market?
The Middle East & Africa Dust Control or Suppression Chemicals Market is valued at US$ 312.06 Million in 2022, it is projected to reach US$ 434.72 Million by 2030.
What is the CAGR for Middle East & Africa Dust Control or Suppression Chemicals Market by (2022 - 2030)?
As per our report Middle East & Africa Dust Control or Suppression Chemicals Market, the market size is valued at US$ 312.06 Million in 2022, projecting it to reach US$ 434.72 Million by 2030. This translates to a CAGR of approximately 4.2% during the forecast period.
What segments are covered in this report?
The Middle East & Africa Dust Control or Suppression Chemicals Market report typically cover these key segments-
Chemical Type (Lignin Sulfonate, Calcium Chloride, Magnesium Chloride, Asphalt Emulsions, Oil Emulsions, Polymeric Emulsions)
End-Use Industry (Mining, Construction, Oil and Gas, Food and Beverage, Textile, Glass and Ceramics, Pharmaceuticals)
What is the historic period, base year, and forecast period taken for Middle East & Africa Dust Control or Suppression Chemicals Market?
The historic period, base year, and forecast period can vary slightly depending on the specific market research report. However, for the Middle East & Africa Dust Control or Suppression Chemicals Market report:
Historic Period : 2020-2021
Base Year : 2022
Forecast Period : 2023-2030
Who are the major players in Middle East & Africa Dust Control or Suppression Chemicals Market?
The Middle East & Africa Dust Control or Suppression Chemicals Market is populated by several key players, each contributing to its growth and innovation. Some of the major players include:
Veolia Environnement SA
Ecolab Inc
Quaker Chemical Corp
Dow Inc
BASF SE
Solenis LLC
Who should buy this report?
The Middle East & Africa Dust Control or Suppression Chemicals Market report is valuable for diverse stakeholders, including:
Investors: Provides insights for investment decisions pertaining to market growth, companies, or industry insights. Helps assess market attractiveness and potential returns.
Industry Players: Offers competitive intelligence, market sizing, and trend analysis to inform strategic planning, product development, and sales strategies.
Suppliers and Manufacturers: Helps understand market demand for components, materials, and services related to concerned industry.
Researchers and Consultants: Provides data and analysis for academic research, consulting projects, and market studies.
Financial Institutions: Helps assess risks and opportunities associated with financing or investing in the concerned market.
Essentially, anyone involved in or considering involvement in the Middle East & Africa Dust Control or Suppression Chemicals Market value chain can benefit from the information contained in a comprehensive market report.


 Get Free Sample For Middle East & Africa Dust Control or Suppression Chemicals Market


