Previsioni di mercato dell\'elettronica di potenza per l\'Asia Pacifico fino al 2030 - Analisi regionale - per tipo (discreti di potenza, moduli di potenza e circuiti integrati di potenza), materiale [silicio (SI), carburo di silicio (SIC), nitruro di gallio (GAN) e altri] e Settore verticale (ICT, automobilistico e trasporti, elettronica di consumo, industriale, energia ed energia e altri)
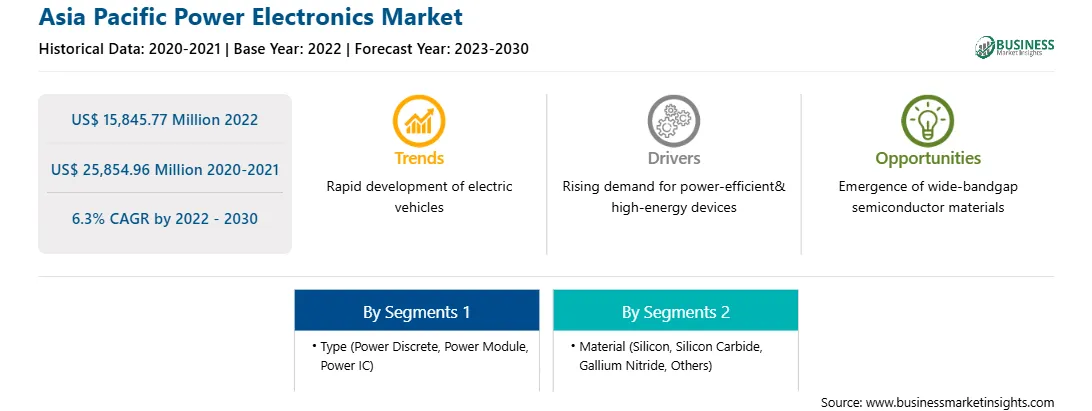
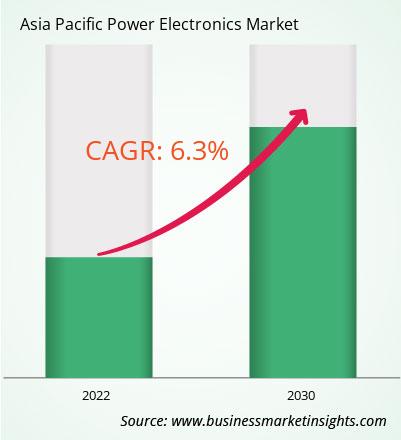
Il mercato dell’elettronica di potenza nell’Asia del Pacifico è stato valutato a 15.845,77 milioni di dollari nel 2022 e si prevede che raggiungerà i 25.854,96 milioni di dollari entro il 2030; si stima che registrerà un CAGR del 6,3% dal 2022 al 2030.
La crescente domanda di elettronica di potenza basata sull\'intelligenza artificiale alimenta il mercato dell\'elettronica di potenza nell\'Asia Pacifico.
I giganti tecnologici di tutto il mondo sono fortemente concentrati sulla ricerca e sviluppo di nuove tecnologie. L’intelligenza artificiale (AI) è posizionata come una delle principali tecnologie software di nuova generazione nel mercato dell’elettronica di potenza. L’intelligenza artificiale (AI) sta trasformando il modo in cui opera l’elettronica di potenza, soprattutto nel controllo del ciclo della qualità dell’energia. L’integrazione dell’intelligenza artificiale nell’elettronica di potenza aiuta le aziende a semplificare le operazioni e ad automatizzare le attività. Ad esempio, nel novembre 2020, Eneryield AB ha creato un metodo predittivo basato sull’intelligenza artificiale per controllare un’ampia gamma di dispositivi elettronici di potenza.
L\'elettronica di potenza basata sull\'intelligenza artificiale è integrata con speciali algoritmi di apprendimento automatico che consentono di utilizzare enormi quantità di dati per prevedere la qualità dell\'energia su diversi cicli. L\'intelligenza artificiale consente all\'elettronica di potenza di gestire attività complesse come la misurazione del segnale, i disturbi di potenza e il monitoraggio in tempo reale. Inoltre, l\'elettronica di potenza utilizza componenti basati sul linguaggio di apprendimento automatico come filtri di potenza attivi per monitorare i tentativi di segnale di tensione e corrente in corso per prevedere il disturbo di potenza in breve tempo. L\'algoritmo di apprendimento automatico fornisce il tempo appropriato all\'elettronica di potenza per preelaborare il segnale monitorato, calcolare la previsione e fornire la previsione al dispositivo di compensazione, che può quindi iniettare il segnale armonico e interarmonico opposto per mitigare attivamente il disturbo. I vantaggi significativi offerti dall’elettronica di potenza basata sull’intelligenza artificiale incoraggiano i produttori a integrare l’intelligenza artificiale nell’elettronica di potenza.
Inoltre, l\'elettronica di potenza basata sull\'intelligenza artificiale aiuta sia i produttori che i consumatori a controllare la fornitura di energia elettrica nei dispositivi. La crescente domanda di elettronica di potenza basata sull’intelligenza artificiale incoraggia le aziende a collaborare tra loro per utilizzare e sviluppare soluzioni avanzate. Ad esempio, nel dicembre 2023, Unipower AB ha annunciato una collaborazione con Eneryield AB per sviluppare elettronica di potenza basata sull\'intelligenza artificiale per applicazioni nella rete elettrica. Questa collaborazione aiuta Unipower AB a utilizzare il modulo di sorveglianza basato sull\'apprendimento automatico di Eneryield AB nelle reti elettriche. Il modulo di sorveglianza basato sull’apprendimento automatico aiuta Unipower AB a prevedere i guasti nelle reti elettriche, il che può portare a una migliore stabilità della rete e sicurezza della fornitura. Pertanto, si prevede che la crescente domanda di elettronica di potenza basata sull’intelligenza artificiale creerà opportunità redditizie per gli operatori del mercato dell’elettronica di potenza durante il periodo di previsione.
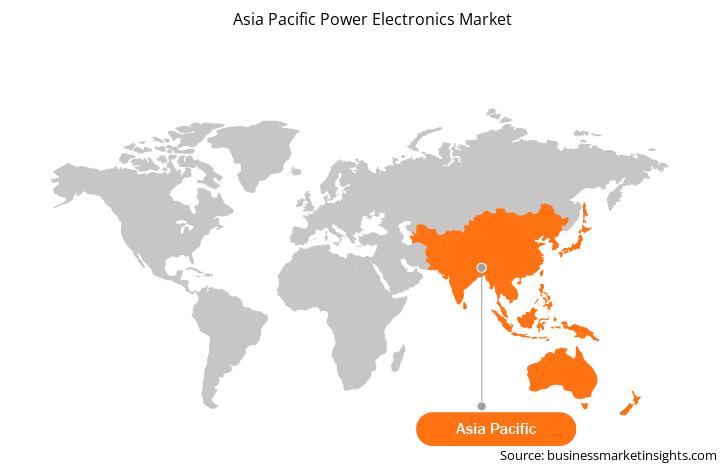
Panoramica del mercato dell\'elettronica di potenza nell\'Asia Pacifico. Si prevede che l\'Asia Pacifico guiderà il mercato dell\'elettronica di potenza con il CAGR più elevato nel periodo di previsione. La presenza significativa dell\'elettronica di consumo può essere collegata all\'espansione del mercato nell\'Asia Pacifico.
La crescente domanda di produzione di energia, così come i tentativi del governo di sostenere la produzione di energia in diversi paesi dell\'Asia del Pacifico, stanno aumentando il costo della produzione di energia. Lo sviluppo delle infrastrutture per l’energia rinnovabile è un fattore critico che guida il mercato globale. Inoltre, si prevede che l’espansione della popolazione nei paesi in via di sviluppo, in particolare Cina e India, che sta aumentando la diffusione delle infrastrutture di comunicazione, alimenterà l’espansione del mercato dell’elettronica di potenza nella regione durante il periodo di previsione. La presenza di attori consolidati nel mercato dell’elettronica di potenza come Renesas Electronics Corporation, Mitsubishi Electric Corporation, Fuji Electric Co. e TOSHIBA CORPORATION nell’Asia del Pacifico stimola la crescita del mercato. Inoltre, lo sviluppo di aziende cinesi come BYO, Huawei, CRRC e Sungrow sta rafforzando il settore dell’elettronica di potenza nazionale in Cina. Tutti questi fattori stanno guidando la crescita del mercato dell’elettronica di potenza nell’Asia del Pacifico.
Entrate e previsioni del mercato dell\'elettronica di potenza nell\'Asia Pacifico fino al 2030 (milioni di dollari)
Segmentazione del mercato dell\'elettronica di potenza nell\'Asia Pacifico
Il mercato dell\'elettronica di potenza nell\'Asia Pacifico è classificato in tipo, materiale, settore verticale e paese.
In base alla tipologia, il mercato dell\'elettronica di potenza dell\'Asia Pacifico è classificato in potenza discreta, modulo di potenza e IC di potenza. Il segmento dei moduli di potenza ha detenuto la quota di mercato maggiore nel 2022.
In termini di materiale, il mercato dell\'elettronica di potenza dell\'Asia Pacifico è classificato in silicio (SI), carburo di silicio (SIC), nitruro di gallio (GAN) e altri. Il segmento del carburo di silicio (SIC) deteneva la quota di mercato maggiore nel 2022.
Per verticale del settore, il mercato dell\'elettronica di potenza dell\'Asia Pacifico è segmentato in ICT, automobilistico e trasporti, elettronica di consumo, industriale, energia e potenza e altri. Il segmento dell\'elettronica di consumo ha detenuto la quota di mercato maggiore nel 2022.
Per paese, il mercato dell\'elettronica di potenza dell\'Asia Pacifico è segmentato in Australia, Cina, Giappone, India, Corea del Sud e resto dell\'Asia Pacifico. La Cina ha dominato la quota di mercato dell\'elettronica di potenza nell\'Asia del Pacifico nel 2022.
Vishay Intertechnology Inc; Toshiba Electronic Devices & Storage Corp; Littelfuse, Inc; Renesas Electronics Corp.; ROHM CoLt; Fuji Electric Co Ltd; Mitsubishi Electric Corp.; STMicroelectronics NV; Semiconductor Components Industries, LLC (Su Semiconduttori); e Infineon Technologies AG sono alcune delle aziende leader che operano nel mercato dell\'elettronica di potenza dell\'Asia Pacifico.
Asia Pacific Power Electronics Strategic Insights
Strategic insights for Asia Pacific Power Electronics involve closely monitoring industry trends, consumer behaviours, and competitor actions to identify opportunities for growth. By leveraging data analytics, businesses can anticipate market shifts and make informed decisions that align with evolving customer needs. Understanding these dynamics helps companies adjust their strategies proactively, enhance customer engagement, and strengthen their competitive edge. Building strong relationships with stakeholders and staying agile in response to changes ensures long-term success in any market.
Get more information on this report
Asia Pacific Power Electronics Report Scope
Report Attribute
Details
Market size in 2022
US$ 15,845.77 Million
Market Size by 2030
US$ 25,854.96 Million
Global CAGR (2022 - 2030)
6.3%
Historical Data
2020-2021
Forecast period
2023-2030
Segments Covered
By Tipo
Potenza discreta
Modulo di potenza
IC di potenza
By Materiale
silicio
carburo di silicio
nitruro di gallio
altri
Regions and Countries Covered
Asia-Pacifico
Cina
India
Giappone
Australia
resto delAsia-Pacifico
Market leaders and key company profiles
Infineon Technologies AG
Semiconductor components Industries, LLC
STMicroelectronics NV
Mitsubishi Electric Corp
Fuji Electric Co Ltd
ROHM Co Ltd
Renesas Electronics Corp
Littelfuse, Inc
Toshiba Electronics Devices & Storage Corp
Vishay Intertechnology Inc
Get more information on this report
Asia Pacific Power Electronics Regional Insights
The regional scope of Asia Pacific Power Electronics refers to the geographical area in which a business operates and competes. Understanding regional nuances, such as local consumer preferences, economic conditions, and regulatory environments, is crucial for tailoring strategies to specific markets. Businesses can expand their reach by identifying underserved regions or adapting their offerings to meet regional demands. A clear regional focus allows for more effective resource allocation, targeted marketing, and better positioning against local competitors, ultimately driving growth in those specific areas.
Get more information on this report
Identical Market Reports with other Region/Countries
The List of Companies - Asia Pacific Power Electronics Market
1. Infineon Technologies AG 2. Semiconductor components Industries, LLC 3. STMicroelectronics NV 4. Mitsubishi Electric Corp 5. Fuji Electric Co Ltd 6. ROHM Co Ltd 7. Renesas Electronics Corp 8. Littelfuse, Inc 9. Toshiba Electronics Devices & Storage Corp 10. Vishay Intertechnology Inc
Frequently Asked Questions
How big is the Asia Pacific Power Electronics Market?
The Asia Pacific Power Electronics Market is valued at US$ 15,845.77 Million in 2022, it is projected to reach US$ 25,854.96 Million by 2030.
What is the CAGR for Asia Pacific Power Electronics Market by (2022 - 2030)?
As per our report Asia Pacific Power Electronics Market, the market size is valued at US$ 15,845.77 Million in 2022, projecting it to reach US$ 25,854.96 Million by 2030. This translates to a CAGR of approximately 6.3% during the forecast period.
What segments are covered in this report?
The Asia Pacific Power Electronics Market report typically cover these key segments-
Tipo (Potenza discreta, Modulo di potenza, IC di potenza)
Materiale (silicio, carburo di silicio, nitruro di gallio, altri)
What is the historic period, base year, and forecast period taken for Asia Pacific Power Electronics Market?
The historic period, base year, and forecast period can vary slightly depending on the specific market research report. However, for the Asia Pacific Power Electronics Market report:
Historic Period : 2020-2021
Base Year : 2022
Forecast Period : 2023-2030
Who are the major players in Asia Pacific Power Electronics Market?
The Asia Pacific Power Electronics Market is populated by several key players, each contributing to its growth and innovation. Some of the major players include:
Infineon Technologies AG
Semiconductor components Industries, LLC
STMicroelectronics NV
Mitsubishi Electric Corp
Fuji Electric Co Ltd
ROHM Co Ltd
Renesas Electronics Corp
Littelfuse, Inc
Toshiba Electronics Devices & Storage Corp
Vishay Intertechnology Inc
Who should buy this report?
The Asia Pacific Power Electronics Market report is valuable for diverse stakeholders, including:
Investors: Provides insights for investment decisions pertaining to market growth, companies, or industry insights. Helps assess market attractiveness and potential returns.
Industry Players: Offers competitive intelligence, market sizing, and trend analysis to inform strategic planning, product development, and sales strategies.
Suppliers and Manufacturers: Helps understand market demand for components, materials, and services related to concerned industry.
Researchers and Consultants: Provides data and analysis for academic research, consulting projects, and market studies.
Financial Institutions: Helps assess risks and opportunities associated with financing or investing in the concerned market.
Essentially, anyone involved in or considering involvement in the Asia Pacific Power Electronics Market value chain can benefit from the information contained in a comprehensive market report.
Get Free Sample For Asia Pacific Power Electronics Market
1. Complete the form
2. Check your inbox (and spam/junk folder)
3. Your Personal Data is Secure with us
GDPR + CCPA Compliant
Personal & transactional information is kept safe from unauthorized use.
WHAT'S INCLUDED IN FULL REPORT : Market Dynamics,
Competitive Analysis and Assessment, Define Business Strategies, Market Outlook and
Trends, Market Size and Share Analysis, Growth Driving Factors, Future Commercial
Potential, Identify Regional Growth Engines


 Get Free Sample For Asia Pacific Power Electronics Market

