Prévisions du marché des vannes d’équilibrage hydroniques en Europe jusqu’en 2031 – Analyse régionale – par type (vannes d’équilibrage statiques, vannes d’équilibrage à orifice fixe, vannes d’équilibrage automatiques et vannes de régulation de débit indépendantes de la pression), type de connexion (à brides, filetées et autres), taille (moins de 5 pouces, 6-10 pouces, 11-20 pouces et plus de 20 pouces) et application (résidentielle, commerciale et industrielle)

BMIRE00031076 | Pages: 92 | Manufacturing and Construction | Dec 2024 | Status: Published
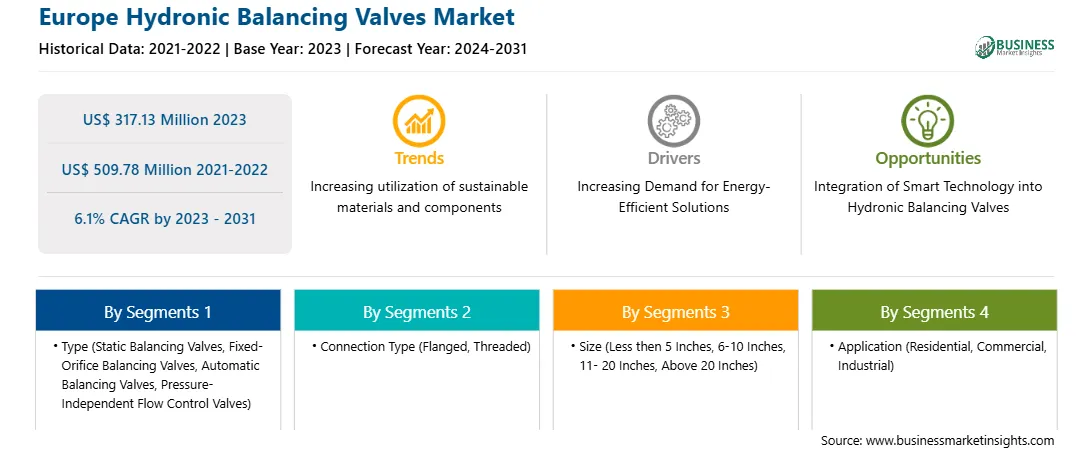
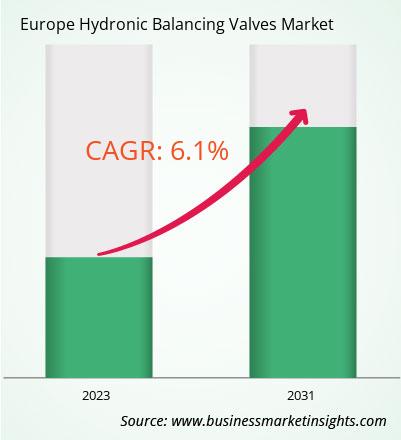
Le marché européen des vannes d\'équilibrage hydroniques était évalué à 317,13 millions USD en 2023 et devrait atteindre 509,78 millions USD d\'ici 2031 ; il devrait enregistrer un TCAC de 6,1 % de 2023 à 2031.

L\'application croissante des vannes d\'équilibrage hydroniques pour les systèmes CVC dans l\'industrie pétrolière et gazière stimule le marché européen des vannes d\'équilibrage hydroniques

Dans l\'industrie pétrolière et gazière, les vannes d\'équilibrage hydroniques aident principalement à réguler et à équilibrer le débit de liquide. Ces vannes permettent de garantir que chaque circuit de chauffage ou de refroidissement reçoit la quantité appropriée de débit de liquide, permettant des performances et une efficacité énergétique optimales. Avec l\'essor rapide de l\'industrialisation, la demande de pétrole et de gaz a considérablement augmenté dans le monde entier. La production de pétrole brut de l\'Organisation des pays exportateurs de pétrole (OPEG) a augmenté régulièrement, passant d\'environ 400 000 b/j en janvier 2016 à environ 800 000 b/j à la fin du deuxième trimestre 2021.

En novembre 2021, Equinor, une société de raffinage du pétrole, a annoncé un investissement de 8,8 milliards de dollars américains pour l\'avancement de la découverte de pétrole de Wisting dans la mer de Barents arctique, le champ pétrolifère le plus septentrional du monde. Le gouvernement russe a également annoncé sa stratégie visant à augmenter la capacité de production de GNL à environ 140 millions de tonnes par an d\'ici 2035. De plus, avec l\'accent toujours croissant mis sur la réduction des émissions de carbone, les gouvernements de plusieurs pays soutiennent les centrales électriques au gaz par rapport aux centrales électriques au charbon, car le gaz naturel émet moins de carbone que le charbon ; cela stimule la demande de gaz naturel. En outre, le système CVC joue un rôle crucial dans l\'industrie pétrolière et gazière pour garantir des conditions de travail adéquates pour un équipement. Les usines de pétrole et de gaz utilisent des systèmes CVC avec des conceptions appropriées axées sur l\'amélioration de la productivité et la garantie de la sécurité dans les environnements dangereux. Ces installations contiennent des machines et des équipements sensibles qui nécessitent des températures contrôlées pour des performances et une longévité optimales. La conception CVC permet de réguler ces conditions, évitant ainsi les dommages aux équipements et les temps d\'arrêt. Les vannes d\'équilibrage hydroniques sont un composant crucial utilisé dans les systèmes CVC. Ainsi, l\'application croissante des vannes d\'équilibrage hydroniques pour les systèmes CVC dans l\'industrie pétrolière et gazière stimule le marché.

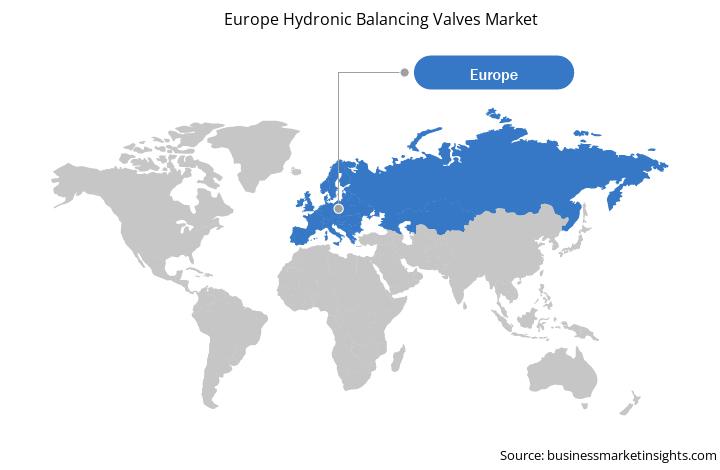
Aperçu du marché européen des vannes d\'équilibrage hydroniques

L\'Allemagne, la France, l\'Italie, le Royaume-Uni et la Russie font partie des principales économies européennes. L\'adoption croissante de systèmes CVC économes en énergie dans la région propulse l\'application de vannes d\'équilibrage hydroniques dans différents pays européens. La demande de systèmes CVC pour le chauffage ou le refroidissement augmente en raison des exigences croissantes dans les espaces industriels, commerciaux et résidentiels, ce qui stimule le marché européen des vannes d\'équilibrage hydroniques en Europe. Français L\'essor de la construction de nouveaux bâtiments résidentiels, la croissance du revenu disponible, l\'augmentation des dépenses moyennes de construction, l\'urbanisation rapide dans plusieurs économies européennes et l\'augmentation des dépenses gouvernementales pour les développements de bâtiments durables sont des facteurs majeurs qui stimulent l\'adoption de systèmes CVC en Europe, ce qui propulse la demande de vannes d\'équilibrage hydroniques. Les réglementations établies par les gouvernements européens conformément à l\'efficacité énergétique et la préférence croissante pour les réfrigérants respectueux de l\'environnement dans des pays comme le Royaume-Uni, l\'Allemagne et la France renforcent la demande de systèmes CVC avancés, ce qui alimente également la croissance du marché européen des vannes d\'équilibrage hydroniques en Europe. La présence de fabricants de vannes d\'équilibrage hydroniques tels qu\'Oventrop GmbH & Co. KG, Caleffi Spa, Frese A/S et d\'autres contribue à la croissance du marché européen des vannes d\'équilibrage hydroniques en Europe.

Chiffre d\'affaires et prévisions du marché des vannes d\'équilibrage hydroniques en Europe jusqu\'en 2031 (en millions de dollars américains)

Segmentation du marché des vannes d\'équilibrage hydroniques en Europe

Le marché européen des vannes d\'équilibrage hydroniques est classé en type, type de connexion, taille, application et pays.

Sur la base des types, le marché européen des vannes d\'équilibrage hydroniques est segmenté en vannes d\'équilibrage statiques, vannes d\'équilibrage à orifice fixe, vannes d\'équilibrage automatiques et vannes de régulation de débit indépendantes de la pression. Le segment des vannes d\'équilibrage statiques détenait la plus grande part de marché en 2023.

En termes de type de connexion, le marché européen des vannes d\'équilibrage hydroniques est segmenté en à brides, filetées et autres. Le segment à brides détenait la plus grande part de marché en 2023.

Par taille, le marché européen des vannes d\'équilibrage hydroniques est segmenté en moins de 5 pouces, 6 à 10 pouces, 11 à 20 pouces et plus de 20 pouces. Français Le segment de moins de 5 pouces détenait la plus grande part de marché en 2023.

Par application, le marché européen des vannes d\'équilibrage hydroniques est segmenté en résidentiel, commercial et industriel. Le segment résidentiel détenait la plus grande part de marché en 2023.

Par pays, le marché européen des vannes d\'équilibrage hydroniques est segmenté en Allemagne, Italie, France, Royaume-Uni, Russie et reste de l\'Europe. L\'Allemagne a dominé la part de marché européenne des vannes d\'équilibrage hydroniques en 2023.

Caleffi Spa, Danfoss AS, Johnson Controls International Plc, Oventrop GmbH & Co. KG, Victaulic Company et Xylem Inc. sont quelques-unes des principales entreprises opérant sur le marché européen des vannes d\'équilibrage hydroniques.

1.           Introduction

1.1       The Insight Partners Research Report Guidance

1.2       Market Segmentation

2.           Executive Summary

2.1       Key Insights

2.2       Market Attractiveness

3.           Research Methodology

3.1       Secondary Research

3.2       Primary Research

3.2.1         Hypothesis formulation:

3.2.2         Macro-economic factor analysis:

3.2.3         Developing base number:

3.2.4         Data Triangulation:

3.2.5         Country level data:

4.           Europe Hydronic Balancing Valves Market Landscape

4.1       Overview

4.2       Ecosystem Analysis

4.2.1         Raw Materials Suppliers-

4.2.2         Manufacturing and Assembly:

4.2.3         Distribution and Logistics:

4.2.4         End Users:

4.2.5         List of Vendors in the Value Chain

5.           Europe Hydronic Balancing Valves Market – Key Market Dynamics

5.1       Europe Hydronic Balancing Valves Market – Key Market Dynamics

5.2       Market Drivers

5.2.1         Increasing Demand for Energy-efficient Solutions

5.2.2         Growing Application of Hydronic Balancing Valves for HVAC Systems in Oil & Gas Industry

5.3       Market Restraints

5.3.1         High Cost of Installation, Repair, and Maintenance of Hydronic Balancing Valves

5.4       Market Opportunities

5.4.1         Integration of Smart Technology into Hydronic Balancing Valves

5.5       Future Trends

5.5.1         Utilization of Sustainable Materials and Components in Public Infrastructure

5.6       Impact of Drivers and Restraints:

6.           Hydronic Balancing Valves Market –Europe Market Analysis

6.1       Overview

6.2       Europe Hydronic Balancing Valves Market Revenue (US$ Million), 2021–2031

6.3       Europe Hydronic Balancing Valves Market Forecast Analysis

7.           Europe Hydronic Balancing Valves Market Analysis – by Type

7.1       Static Balancing Valves

7.1.1         Overview

7.1.2         Static Balancing Valves: Europe Hydronic Balancing Valves Market – Revenue and Forecast to 2031  (US$ Million)

7.2       Fixed-Orifice Balancing Valves

7.2.1         Overview

7.2.2         Fixed-Orifice Balancing Valves: Europe Hydronic Balancing Valves Market – Revenue and Forecast to 2031 (US$ Million)

7.3       Automatic Balancing Valves

7.3.1         Overview

7.3.2         Automatic Balancing Valves: Europe Hydronic Balancing Valves Market – Revenue and Forecast to 2031 (US$ Million)

7.4       Pressure-Independent Flow Control Valves

7.4.1         Overview

7.4.2         Pressure-Independent Flow Control Valves: Europe Hydronic Balancing Valves Market – Revenue and Forecast to 2031 (US$ Million)

8.           Europe Hydronic Balancing Valves Market Analysis – by Connection Type

8.1       Flanged

8.1.1         Overview

8.1.2         Flanged: Europe Hydronic Balancing Valves Market – Revenue and Forecast to 2031 (US$ Million)

8.2       Threaded

8.2.1         Overview

8.2.2         Threaded: Europe Hydronic Balancing Valves Market – Revenue and Forecast to 2031 (US$ Million)

8.3       Others

8.3.1         Overview

8.3.2         Others: Europe Hydronic Balancing Valves Market – Revenue and Forecast to 2031 (US$ Million)

9.           Europe Hydronic Balancing Valves Market Analysis – by Size

9.1       Less than 5 Inches

9.1.1         Overview

9.1.2         Less than 5 Inches: Europe Hydronic Balancing Valves Market – Revenue and Forecast to 2031  (US$ Million)

9.2       6-10 Inches

9.2.1         Overview

9.2.2         6-10 Inches: Europe Hydronic Balancing Valves Market – Revenue and Forecast to 2031 (US$ Million)

9.3       11 - 20 Inches

9.3.1         Overview

9.3.2         11-20 Inches: Europe Hydronic Balancing Valves Market – Revenue and Forecast to 2031 (US$ Million)

9.4       Above 20 Inches

9.4.1         Overview

9.4.2         Above 20 Inches: Europe Hydronic Balancing Valves Market – Revenue and Forecast to 2031  (US$ Million)

10.        Europe Hydronic Balancing Valves Market Analysis – by Application

10.1     Residential

10.1.1       Overview

10.1.2       Residential: Europe Hydronic Balancing Valves Market – Revenue and Forecast to 2031 (US$ Million)

10.2     Commercial

10.2.1       Overview

10.2.2       Commercial: Europe Hydronic Balancing Valves Market – Revenue and Forecast to 2031 (US$ Million)

10.3     Industrial

10.3.1       Overview

10.3.2       Industrial: Europe Hydronic Balancing Valves Market – Revenue and Forecast to 2031 (US$ Million)

11.        Europe Hydronic Balancing Valves Market – Country Analysis

11.1     Europe Hydronic Balancing Valves Market, By Key Countries- Revenue (2023) (US$ Million)

11.1.1       Europe Hydronic Balancing Valves Market by Key Countries, 2023 and 2031 (%)

11.1.1.1          Europe Hydronic Balancing Valves Market – Revenue and Forecast Analysis – by Country

11.1.1.2          Germany: Europe Hydronic Balancing Valves Market – Revenue and Forecast to 2031 (US$ Million)

11.1.1.2.1        Germany: Europe Hydronic Balancing Valves Market Breakdown, by Type

11.1.1.2.2        Germany: Europe Hydronic Balancing Valves Market Breakdown, by Connection Type

11.1.1.2.3        Germany: Europe Hydronic Balancing Valves Market Breakdown, by Size

11.1.1.2.4        Germany: Europe Hydronic Balancing Valves Market Breakdown, by Application

11.1.1.3          Italy: Europe Hydronic Balancing Valves Market – Revenue and Forecast to 2031 (US$ Million)

11.1.1.3.1        Italy: Europe Hydronic Balancing Valves Market Breakdown, by Type

11.1.1.3.2        Italy: Europe Hydronic Balancing Valves Market Breakdown, by Connection Type

11.1.1.3.3        Italy: Europe Hydronic Balancing Valves Market Breakdown, by Size

11.1.1.3.4        Italy: Europe Hydronic Balancing Valves Market Breakdown, by Application

11.1.1.4          France: Europe Hydronic Balancing Valves Market – Revenue and Forecast to 2031 (US$ Million)

11.1.1.4.1        France: Europe Hydronic Balancing Valves Market Breakdown, by Type

11.1.1.4.2        France: Europe Hydronic Balancing Valves Market Breakdown, by Connection Type

11.1.1.4.3        France: Europe Hydronic Balancing Valves Market Breakdown, by Size

11.1.1.4.4        France: Europe Hydronic Balancing Valves Market Breakdown, by Application

11.1.1.5          United Kingdom: Europe Hydronic Balancing Valves Market – Revenue and Forecast to 2031 (US$ Million)

11.1.1.5.1        United Kingdom: Europe Hydronic Balancing Valves Market Breakdown, by Type

11.1.1.5.2        United Kingdom: Europe Hydronic Balancing Valves Market Breakdown, by Connection Type

11.1.1.5.3        United Kingdom: Europe Hydronic Balancing Valves Market Breakdown, by Size

11.1.1.5.4        United Kingdom: Europe Hydronic Balancing Valves Market Breakdown, by Application

11.1.1.6          Russia: Europe Hydronic Balancing Valves Market – Revenue and Forecast to 2031 (US$ Million)

11.1.1.6.1        Russia: Europe Hydronic Balancing Valves Market Breakdown, by Type

11.1.1.6.2        Russia: Europe Hydronic Balancing Valves Market Breakdown, by Connection Type

11.1.1.6.3        Russia: Europe Hydronic Balancing Valves Market Breakdown, by Size

11.1.1.6.4        Russia: Europe Hydronic Balancing Valves Market Breakdown, by Application

11.1.1.7          Rest of Europe Hydronic Balancing Valves Market – Revenue and Forecast to 2031 (US$ Million)

11.1.1.7.1        Rest of Europe Hydronic Balancing Valves Market Breakdown, by Type

11.1.1.7.2        Rest of Europe Hydronic Balancing Valves Market Breakdown, by Connection Type

11.1.1.7.3        Rest of Europe Hydronic Balancing Valves Market Breakdown, by Size

11.1.1.7.4        Rest of Europe Hydronic Balancing Valves Market Breakdown, by Application

12.        Competitive Landscape

12.1     Company Positioning & Concentration

12.2     Heat Map Analysis

13.        Industry Landscape

13.1     Overview

13.2     Market Initiative

13.3     Product Development

13.4     Mergers & Acquisitions

14.        Company Profiles

14.1     Danfoss AS

14.1.1       Key Facts

14.1.2       Business Description

14.1.3       Products and Services

14.1.4       Financial Overview

14.1.5       SWOT Analysis

14.1.6       Key Developments

14.2     Johnson Controls International Plc

14.2.1       Key Facts

14.2.2       Business Description

14.2.3       Products and Services

14.2.4       Financial Overview

14.2.5       SWOT Analysis

14.2.6       Key Developments

14.3     Xylem Inc.

14.3.1       Key Facts

14.3.2       Business Description

14.3.3       Products and Services

14.3.4       Financial Overview

14.3.5       SWOT Analysis

14.3.6       Key Developments

14.4     Victaulic Company

14.4.1       Key Facts

14.4.2       Business Description

14.4.3       Products and Services

14.4.4       Financial Overview

14.4.5       SWOT Analysis

14.4.6       Key Developments

14.5     Frese A/S

14.5.1       Key Facts

14.5.2       Business Description

14.5.3       Products and Services

14.5.4       Financial Overview

14.5.5       SWOT Analysis

14.5.6       Key Developments

14.6     Oventrop GmbH & Co. KG

14.6.1       Key Facts

14.6.2       Business Description

14.6.3       Products and Services

14.6.4       Financial Overview

14.6.5       SWOT Analysis

14.6.6       Key Developments

14.7     Caleffi S.p.a.

14.7.1       Key Facts

14.7.2       Business Description

14.7.3       Products and Services

14.7.4       Financial Overview

14.7.5       SWOT Analysis

14.7.6       Key Developments

15.        Appendix

15.1     About The Insight Partners


List of Tables

Table 1.             Europe Hydronic Balancing Valves Market Segmentation

Table 2.             List of Vendors

Table 3.             Europe Hydronic Balancing Valves Market – Revenue and Forecast to 2031 (US$ Million)

Table 4.             Europe Hydronic Balancing Valves Market – Revenue and Forecast to 2031 (US$ Million) – by Type

Table 5.             Europe Hydronic Balancing Valves Market – Revenue and Forecast to 2031 (US$ Million) – by Connection Type

Table 6.             Europe Hydronic Balancing Valves Market – Revenue and Forecast to 2031 (US$ Million) – by Size

Table 7.             Europe Hydronic Balancing Valves Market – Revenue and Forecast to 2031 (US$ Million) – by Application

Table 8.             Europe Hydronic Balancing Valves Market – Revenue and Forecast to 2031(US$ Million) – by Country

Table 9.             Germany: Europe Hydronic Balancing Valves Market – Revenue and Forecast to 2031(US$ Million) – by Type

Table 10.          Germany: Europe Hydronic Balancing Valves Market – Revenue and Forecast to 2031(US$ Million) – by Connection Type

Table 11.          Germany: Europe Hydronic Balancing Valves Market – Revenue and Forecast to 2031(US$ Million) – by Size

Table 12.          Germany: Europe Hydronic Balancing Valves Market – Revenue and Forecast to 2031(US$ Million) – by Application

Table 13.          Italy: Europe Hydronic Balancing Valves Market – Revenue and Forecast to 2031(US$ Million) – by Type

Table 14.          Italy: Europe Hydronic Balancing Valves Market – Revenue and Forecast to 2031(US$ Million) – by Connection Type

Table 15.          Italy: Europe Hydronic Balancing Valves Market – Revenue and Forecast to 2031(US$ Million) – by Size

Table 16.          Italy: Europe Hydronic Balancing Valves Market – Revenue and Forecast to 2031(US$ Million) – by Application

Table 17.          France: Europe Hydronic Balancing Valves Market – Revenue and Forecast to 2031(US$ Million) – by Type

Table 18.          France: Europe Hydronic Balancing Valves Market – Revenue and Forecast to 2031(US$ Million) – by Connection Type

Table 19.          France: Europe Hydronic Balancing Valves Market – Revenue and Forecast to 2031(US$ Million) – by Size

Table 20.          France: Europe Hydronic Balancing Valves Market – Revenue and Forecast to 2031(US$ Million) – by Application

Table 21.          United Kingdom: Europe Hydronic Balancing Valves Market – Revenue and Forecast to 2031(US$ Million) –  by Type

Table 22.          United Kingdom: Europe Hydronic Balancing Valves Market – Revenue and Forecast to 2031(US$ Million) – by Connection Type

Table 23.          United Kingdom: Europe Hydronic Balancing Valves Market – Revenue and Forecast to 2031(US$ Million) –  by Size

Table 24.          United Kingdom: Europe Hydronic Balancing Valves Market – Revenue and Forecast to 2031(US$ Million) –  by Application

Table 25.          Russia: Europe Hydronic Balancing Valves Market – Revenue and Forecast to 2031(US$ Million) – by Type

Table 26.          Russia: Europe Hydronic Balancing Valves Market – Revenue and Forecast to 2031(US$ Million) –  by Connection Type

Table 27.          Russia: Europe Hydronic Balancing Valves Market – Revenue and Forecast to 2031(US$ Million) – by Size

Table 28.          Russia: Europe Hydronic Balancing Valves Market – Revenue and Forecast to 2031(US$ Million) – by Application

Table 29.          Rest of Europe Hydronic Balancing Valves Market – Revenue and Forecast to 2031(US$ Million) – by Type

Table 30.          Rest of Europe Hydronic Balancing Valves Market – Revenue and Forecast to 2031(US$ Million) – by Connection Type

Table 31.          Rest of Europe Hydronic Balancing Valves Market – Revenue and Forecast to 2031(US$ Million) – by Size

Table 32.          Rest of Europe Hydronic Balancing Valves Market – Revenue and Forecast to 2031(US$ Million) – by Application

List of Figures

Figure 1.           Europe Hydronic Balancing Valves Market Segmentation, by Country

Figure 2.           Impact Analysis of Drivers and Restraints

Figure 3.           Europe Hydronic Balancing Valves Market Revenue (US$ Million), 2021–2031

Figure 4.           Europe Hydronic Balancing Valves Market Share (%) – by Type (2023 and 2031)

Figure 5.           Static Balancing Valves: Europe Hydronic Balancing Valves Market – Revenue and Forecast to 2031  (US$ Million)

Figure 6.           Fixed-Orifice Balancing Valves: Europe Hydronic Balancing Valves Market – Revenue and Forecast to 2031  (US$ Million)

Figure 7.           Automatic Balancing Valves: Europe Hydronic Balancing Valves Market – Revenue and Forecast to 2031  (US$ Million)

Figure 8.           Pressure-Independent Flow Control Valves: Europe Hydronic Balancing Valves Market – Revenue and Forecast to 2031 (US$ Million)

Figure 9.           Europe Hydronic Balancing Valves Market Share (%) – by Connection Type (2023 and 2031)

Figure 10.        Flanged: Europe Hydronic Balancing Valves Market – Revenue and Forecast to 2031 (US$ Million)

Figure 11.        Threaded: Europe Hydronic Balancing Valves Market – Revenue and Forecast to 2031 (US$ Million)

Figure 12.        Others: Europe Hydronic Balancing Valves Market – Revenue and Forecast to 2031 (US$ Million)

Figure 13.        Europe Hydronic Balancing Valves Market Share (%) – by Size (2023 and 2031)

Figure 14.        Less than 5 Inches: Europe Hydronic Balancing Valves Market – Revenue and Forecast to 2031 (US$ Million)

Figure 15.        6-10 Inches: Europe Hydronic Balancing Valves Market – Revenue and Forecast to 2031 (US$ Million)

Figure 16.      11-20 Inches: Europe Hydronic Balancing Valves Market – Revenue and Forecast to 2031 (US$ Million)

Figure 17.        Above 20 Inches: Europe Hydronic Balancing Valves Market – Revenue and Forecast to 2031 (US$ Million)

Figure 18.        Europe Hydronic Balancing Valves Market Share (%) – by Application (2023 and 2031)

Figure 19.        Residential: Europe Hydronic Balancing Valves Market – Revenue and Forecast to 2031 (US$ Million)

Figure 20.        Commercial: Europe Hydronic Balancing Valves Market – Revenue and Forecast to 2031 (US$ Million)

Figure 21.        Industrial: Europe Hydronic Balancing Valves Market – Revenue and Forecast to 2031 (US$ Million)

Figure 22.        Europe Hydronic Balancing Valves Market, By Key Countries – Revenue (2023) (US$ Million)

Figure 23.        Europe Hydronic Balancing Valves Market Breakdown, by Key Countries, 2023 and 2031 (%)

Figure 24.        Germany: Europe Hydronic Balancing Valves Market – Revenue and Forecast to 2031(US$ Million)

Figure 25.        Italy: Europe Hydronic Balancing Valves Market – Revenue and Forecast to 2031(US$ Million)

Figure 26.        France: Europe Hydronic Balancing Valves Market – Revenue and Forecast to 2031(US$ Million)

Figure 27.        United Kingdom: Europe Hydronic Balancing Valves Market – Revenue and Forecast to 2031(US$ Million)

Figure 28.        Russia: Europe Hydronic Balancing Valves Market – Revenue and Forecast to 2031(US$ Million)

Figure 29.        Rest of Europe Hydronic Balancing Valves Market – Revenue and Forecast to 2031(US$ Million)

Figure 30.        Company Positioning & Concentration

Figure 31.        Heat Map Analysis

  • Caleffi S.p.a.
  • Danfoss AS 
  • Johnson Controls International Plc
  • Oventrop GmbH & Co. KG 
  • Victaulic Company 
  • Xylem Inc.
  • Frese A/S
  • Save and reduce time carrying out entry-level research by identifying the growth, size, leading players, and segments in the Europe hydronic balancing valves market.    
  • Highlights key business priorities in order to assist companies to realign their business strategies.
  • The key findings and recommendations highlight crucial progressive industry trends in the Europe hydronic balancing valves market, thereby allowing players across the value chain to develop effective long-term strategies.
  • Develop/modify business expansion plans by using substantial growth offering developed and emerging markets.
  • Scrutinize in-depth Europe market trends and outlook coupled with the factors driving the Europe hydronic balancing valves market, as well as those hindering it.
  • Enhance the decision-making process by understanding the strategies that underpin commercial interest with respect to client products, segmentation, pricing, and distribution.
Report Code
Full Name
Country Name
Email Id
Phone Number
Job Title
Company
Requirement

Note : Your data will never be shared with third parties, however, we may send you information from time to time about our products that may be of interest to you. By submitting your details, you agree to be contacted by us. You may contact us at any time to opt-out.


Purchase Options
Single User License
$3550
$2840
Site License
$4550
$3640
Enterprise License
$5550
$4440