Prévisions du marché Asie-Pacifique de l’analyse des dépenses pour l’électronique et les semi-conducteurs jusqu’en 2030 – Analyse régionale – par composant (logiciel et service), type (analyse descriptive, analyse prédictive et analyse prescriptive), déploiement (sur site et cloud) et application (analyse financière) gestion, gestion des risques, gestion de la gouvernance et de la conformité, approvisionnement des fournisseurs et gestion des performances, prévision de la demande et de l\'offre, et autres)
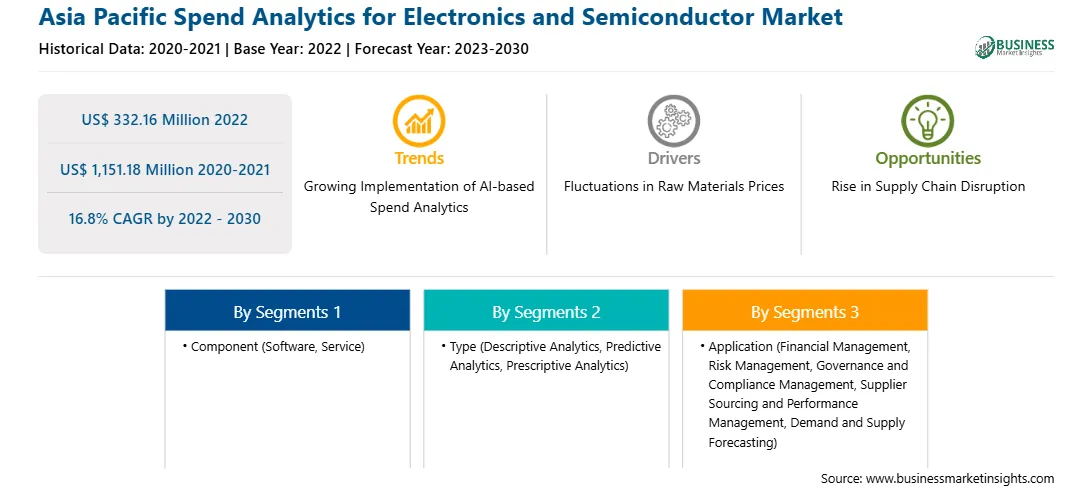
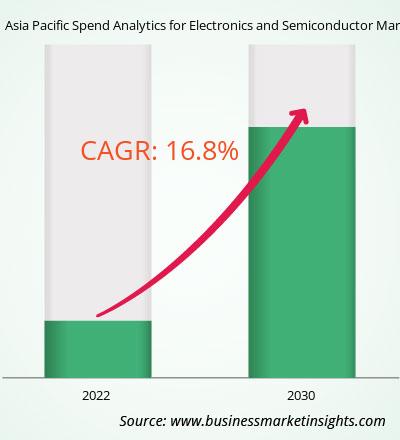
Les dépenses d’analyse des dépenses en Asie-Pacifique pour le marché de l’électronique et des semi-conducteurs étaient évaluées à 332,16 millions de dollars américains en 2022 et devraient atteindre 1 151,18 millions de dollars américains d’ici 2030 ; on estime qu\'il enregistrera un TCAC de 16,8 % de 2022 à 2030.
L\'incorporation d\'appareils électroniques miniaturisés stimule l\'analyse des dépenses en Asie-Pacifique pour le marché de l\'électronique et des semi-conducteurs.
L\'incorporation croissante d\'appareils électroniques miniaturisés, tels que des micropuces et des capteurs, nécessite l\'utilisation de l\'analyse des dépenses dans le secteur de l\'électronique et des semi-conducteurs. Les entreprises doivent gérer efficacement leurs dépenses en composants, matériaux et processus de fabrication pour garantir la rentabilité. Le développement de l\'électronique numérique, notamment la réduction des prix des microprocesseurs, l\'augmentation de la capacité de mémoire, l\'amélioration des capteurs et les progrès des pixels des appareils photo numériques, peut être attribué à la tendance actuelle à la miniaturisation. Les circuits intégrés ont profondément marqué le domaine de l’électronique, permettant la miniaturisation des appareils et des fonctionnalités améliorées. L\'adoption croissante de la technologie des semi-conducteurs, associée au besoin de miniaturisation et d\'incorporation de composants électroniques, a créé une demande d\'analyse des dépenses dans l\'industrie de l\'électronique et des semi-conducteurs. En analysant leurs dépenses en composants, matériaux et processus de fabrication, les entreprises peuvent identifier des solutions permettant de réaliser des économies, optimiser leur chaîne d\'approvisionnement et garantir la rentabilité de la production d\'appareils électroniques miniaturisés. Ainsi, l’incorporation d’appareils électroniques miniaturisés devrait créer des opportunités d’analyse des dépenses pour la croissance du marché de l’électronique et des semi-conducteurs au cours de la période de prévision.
Aperçu du marché de l\'analyse des dépenses en électronique et semi-conducteurs en Asie-Pacifique
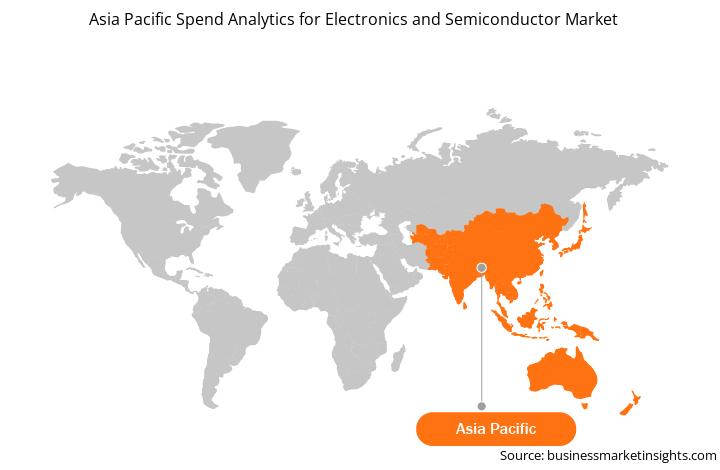
Le marché de l\'analyse des dépenses en électronique et semi-conducteurs en Asie-Pacifique devrait connaître une croissance rapide dans les années à venir. Les progrès du marché dans cette région peuvent être attribués à l’acceptation croissante des outils d’analyse par les consommateurs et les entreprises. Le secteur du Big Data et de l’analyse connaît une croissance significative des dépenses et des revenus en Asie-Pacifique. La région Asie-Pacifique connaît une demande croissante de logiciels d\'analyse des dépenses, motivée par l\'adoption accrue d\'outils d\'analyse, la croissance des secteurs du Big Data et de l\'analyse, ainsi que les besoins spécifiques de secteurs tels que les télécommunications, la banque, le gouvernement central et la fabrication discrète. et des services professionnels. La Chine, le Japon et l’Inde sont à l’avant-garde de l’adoption de l’analyse des dépenses dans la région, stimulés par l’explosion des données, l’urbanisation, le développement de l’apprentissage automatique et de nombreuses MPME. Les principaux acteurs du secteur de l\'électronique et des semi-conducteurs en Asie-Pacifique comprennent Powerchip Semiconductor Manufacturing (PSMC), Taiwan Semiconductor Manufacturing Company (TSMC), United Microelectronics (UMC) et Vanguard International Semiconductor (VIS).
L\'adoption de l\'analyse des dépenses permet aux organisations du marché de l\'électronique et des semi-conducteurs d\'optimiser les processus d\'achat et de prendre des décisions de dépenses éclairées. En analysant les modèles de dépenses, les organisations peuvent identifier les opportunités de réduction des coûts, de gérer efficacement les fournisseurs et d\'atténuer les risques résultant des perturbations de la chaîne d\'approvisionnement. L\'analyse des dépenses est également utile pour faire face aux perturbations de la chaîne d\'approvisionnement, qui sont de plus en plus répandues dans la région Asie-Pacifique en raison des menaces géopolitiques et d\'autres événements mondiaux. La récente pénurie de semi-conducteurs qui a touché l’industrie souligne la nécessité d’améliorer la gestion de la chaîne d’approvisionnement. En surveillant et en analysant de près les données de dépenses, les organisations peuvent identifier des fournisseurs alternatifs, gérer efficacement les coûts et garantir un approvisionnement stable en composants électroniques et semi-conducteurs.
Analyse des dépenses en Asie-Pacifique pour les revenus et prévisions du marché de l\'électronique et des semi-conducteurs jusqu\'en 2030 (millions de dollars américains)
Analyse des dépenses en Asie-Pacifique pour la segmentation du marché de l\'électronique et des semi-conducteurs
Asie-Pacifique L’analyse des dépenses pour le marché de l’électronique et des semi-conducteurs est segmentée en fonction du composant, du type, du déploiement, de l’application et du pays. Sur la base des composants, l’analyse des dépenses en Asie-Pacifique pour le marché de l’électronique et des semi-conducteurs est divisée en logiciels et services. Les services logiciels détenaient une part de marché plus importante en 2022.
En fonction du type, le marché de l\'analyse des dépenses en Asie-Pacifique pour l\'électronique et les semi-conducteurs est segmenté en analyse descriptive, analyse prédictive et analyse prescriptive. L\'analyse prédictive détenait la plus grande part de marché en 2022.
Sur la base du déploiement, le marché de l\'analyse des dépenses en Asie-Pacifique pour l\'électronique et les semi-conducteurs est divisé en sur site et dans le cloud. Le cloud détenait une part de marché plus importante en 2022.
Sur la base des applications, le marché de l\'analyse des dépenses en Asie-Pacifique pour l\'électronique et les semi-conducteurs est segmenté en gestion financière, gestion des risques, gestion de la gouvernance et de la conformité, sourcing des fournisseurs et gestion des performances, prévision de l’offre et de la demande, et autres. L\'approvisionnement des fournisseurs et la gestion des performances détenaient la plus grande part de marché en 2022.
En fonction des pays, le marché de l\'analyse des dépenses en Asie-Pacifique pour l\'électronique et les semi-conducteurs est segmenté en Australie, Chine, Inde, Japon, Corée du Sud et Reste de l\'Asie-Pacifique. La Chine a dominé la part de marché de l\'analyse des dépenses en Asie-Pacifique pour l\'électronique et les semi-conducteurs en 2022.
Coupa Software Inc, International Business Machines Corp, Ivalua Inc, NB Ventures Inc, SAP SE, Scanmarket AS, Synertrade Inc et Zycus Inc. font partie des principales sociétés opérant sur le marché de l\'analyse des dépenses en Asie-Pacifique pour l\'électronique et les semi-conducteurs.
Asia Pacific Spend Analytics for Electronics and Semiconductor Strategic Insights
Strategic insights for Asia Pacific Spend Analytics for Electronics and Semiconductor involve closely monitoring industry trends, consumer behaviours, and competitor actions to identify opportunities for growth. By leveraging data analytics, businesses can anticipate market shifts and make informed decisions that align with evolving customer needs. Understanding these dynamics helps companies adjust their strategies proactively, enhance customer engagement, and strengthen their competitive edge. Building strong relationships with stakeholders and staying agile in response to changes ensures long-term success in any market.
Get more information on this report
Asia Pacific Spend Analytics for Electronics and Semiconductor Report Scope
Asia Pacific Spend Analytics for Electronics and Semiconductor Regional Insights
The regional scope of Asia Pacific Spend Analytics for Electronics and Semiconductor refers to the geographical area in which a business operates and competes. Understanding regional nuances, such as local consumer preferences, economic conditions, and regulatory environments, is crucial for tailoring strategies to specific markets. Businesses can expand their reach by identifying underserved regions or adapting their offerings to meet regional demands. A clear regional focus allows for more effective resource allocation, targeted marketing, and better positioning against local competitors, ultimately driving growth in those specific areas.
Get more information on this report
Identical Market Reports with other Region/Countries
The List of Companies - Asia Pacific Spend Analytics for Electronics and Semiconductor Market
1. Coupa Software Inc 2. International Business Machines Corp 3. Ivalua Inc 4. NB Ventures Inc 5. SAP SE 6. Scanmarket AS 7. Synertrade Inc 8. Zycus Inc
Frequently Asked Questions
How big is the Asia Pacific Spend Analytics for Electronics and Semiconductor Market?
The Asia Pacific Spend Analytics for Electronics and Semiconductor Market is valued at US$ 332.16 Million in 2022, it is projected to reach US$ 1,151.18 Million by 2030.
What is the CAGR for Asia Pacific Spend Analytics for Electronics and Semiconductor Market by (2022 - 2030)?
As per our report Asia Pacific Spend Analytics for Electronics and Semiconductor Market, the market size is valued at US$ 332.16 Million in 2022, projecting it to reach US$ 1,151.18 Million by 2030. This translates to a CAGR of approximately 16.8% during the forecast period.
What segments are covered in this report?
The Asia Pacific Spend Analytics for Electronics and Semiconductor Market report typically cover these key segments-
Composant (logiciel, service)
Type (analyse descriptive, analyse prédictive, analyse prescriptive)
Application (gestion financière, gestion des risques, gouvernance et gestion de la conformité, approvisionnement et gestion des performances des fournisseurs, prévision de l\'offre et de la demande)
What is the historic period, base year, and forecast period taken for Asia Pacific Spend Analytics for Electronics and Semiconductor Market?
The historic period, base year, and forecast period can vary slightly depending on the specific market research report. However, for the Asia Pacific Spend Analytics for Electronics and Semiconductor Market report:
Historic Period : 2020-2021
Base Year : 2022
Forecast Period : 2023-2030
Who are the major players in Asia Pacific Spend Analytics for Electronics and Semiconductor Market?
The Asia Pacific Spend Analytics for Electronics and Semiconductor Market is populated by several key players, each contributing to its growth and innovation. Some of the major players include:
Coupa Software Inc
International Business Machines Corp
Ivalua Inc
NB Ventures Inc
SAP SE
Scanmarket AS
Synertrade Inc
Zycus Inc
Who should buy this report?
The Asia Pacific Spend Analytics for Electronics and Semiconductor Market report is valuable for diverse stakeholders, including:
Investors: Provides insights for investment decisions pertaining to market growth, companies, or industry insights. Helps assess market attractiveness and potential returns.
Industry Players: Offers competitive intelligence, market sizing, and trend analysis to inform strategic planning, product development, and sales strategies.
Suppliers and Manufacturers: Helps understand market demand for components, materials, and services related to concerned industry.
Researchers and Consultants: Provides data and analysis for academic research, consulting projects, and market studies.
Financial Institutions: Helps assess risks and opportunities associated with financing or investing in the concerned market.
Essentially, anyone involved in or considering involvement in the Asia Pacific Spend Analytics for Electronics and Semiconductor Market value chain can benefit from the information contained in a comprehensive market report.
Get Free Sample For Asia Pacific Spend Analytics for Electronics and Semiconductor Market
1. Complete the form
2. Check your inbox (and spam/junk folder)
3. Your Personal Data is Secure with us
GDPR + CCPA Compliant
Personal & transactional information is kept safe from unauthorized use.
WHAT'S INCLUDED IN FULL REPORT : Market Dynamics,
Competitive Analysis and Assessment, Define Business Strategies, Market Outlook and
Trends, Market Size and Share Analysis, Growth Driving Factors, Future Commercial
Potential, Identify Regional Growth Engines


 Get Free Sample For Asia Pacific Spend Analytics for Electronics and Semiconductor Market

