Analysis - by Component (Solution and Service), Deployment (On-Premise and Cloud), Organization Size (SMEs and Large Enterprises), and Application (Academic Research and Industrial Research & Manufacturing)
No. of Pages:81
Report Code:
BMIRE00030380
Category:
Technology, Media and Telecommunications
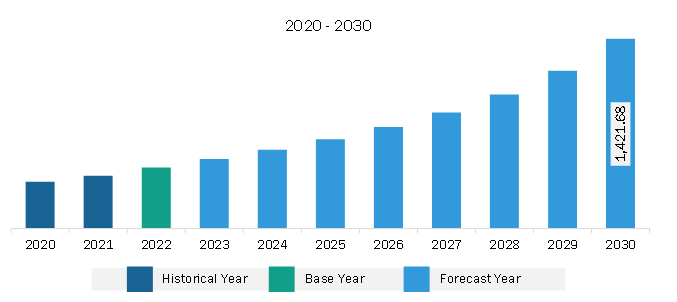
The Asia Pacific photonic design automation market was valued at US$ 458.84 million in 2022 and is expected to reach US$ 1,421.68 million by 2030; it is estimated to register at a CAGR of 15.2% from 2022 to 2030.
Growing Demand for Automation Boosts Asia Pacific Photonic Design Automation Market
Automation enables efficient and streamlined design processes, leading to improved productivity and reduced time-to-market. The field of photonic design automation is experiencing a rise in demand owing to the increasing need for automation across various industries, including manufacturing. This increasing demand for automation is a key driver for the Asia Pacific photonic design automation market. Automation plays a crucial role in enabling more efficient and streamlined design processes within the field of photonics. By automating certain aspects of the design workflow, such as layout generation, component placement, and optimization, designers can significantly enhance their productivity and reduce the time it takes to bring new photonic products to market. The benefits of automation in photonic design are manifold. It allows designers to explore a wider design space and quickly iterate through different design options, leading to improved performance and higher-quality designs. Automation also helps reduce human errors and ensures consistency in the design process, resulting in more reliable and robust photonic devices.
Furthermore, automation in photonic design enables designers to leverage advanced algorithms and optimization techniques to achieve optimal designs. By automating the design optimization process, designers can maximize the performance, efficiency, and manufacturability of photonic devices, ultimately leading to improved product quality and customer satisfaction. For instance, according to a report published by Salesforce in June 2022, there has been a significant surge in the demand for automation among business teams in more than 90% of organizations. This increase in demand has been observed over the past two years, highlighting a growing recognition of the benefits and value that automation can bring to businesses across various industries. The report sheds light on the rising trend of organizations seeking to streamline their processes, improve efficiency, and optimize productivity by adopting automation technologies. This data underscores the growing importance of automation as a strategic tool for organizations looking to stay driven and meet the evolving needs of their customers and stakeholders.
Asia Pacific Photonic Design Automation Market Overview
The market in Asia Pacific is segmented into Japan, China, South Korea, Taiwan, and the Rest of Asia Pacific. Asia Pacific is a significant player in the photonic design automation market, characterized by its rapid growth and technological advancements. With a strong emphasis on innovation and a thriving semiconductor industry, the region has become a hub for cutting-edge photonics technologies. One of the major factors driving the Asia Pacific photonic design automation market is the region's dominance in the semiconductor industry. Countries in Asia Pacific, such as China, South Korea, and Taiwan, have emerged as a global leader in semiconductor manufacturing and chip design. This dominance in the semiconductor supply chain provides a strong foundation for the development and adoption of photonic design automation technologies.
Asia Pacific also boasts a large and growing market for photonic design automation solutions. Various industries, including telecommunications, healthcare, consumer electronics, and automotive, drive the demand for these solutions. The increasing adoption of photonics technologies in these sectors fuels the growth of the photonic design automation market in the region. Furthermore, government initiatives and policies are crucial in promoting the development and adoption of photonic design automation technologies in Asia Pacific. Governments in countries such as Japan, China, and South Korea have implemented strategic plans and funding programs to support the growth of the photonics industry. These initiatives aim to enhance research capabilities, foster collaboration between academia and industry, and create a favorable environment for innovation and entrepreneurship.
Asia Pacific Photonic Design Automation Market Revenue and Forecast to 2030 (US$ Million)
Asia Pacific Photonic Design Automation Market Segmentation
The Asia Pacific photonic design automation market is segmented based on component, deployment, organization size, application, and country.
Based on component, the Asia Pacific photonic design automation market photonic design automation market is bifurcated into solution and service. The solution segment held the largest share in 2022.
In terms of deployment, the Asia Pacific photonic design automation market photonic design automation market is bifurcated into on-premise and cloud. The on-premise segment held a larger share in 2022.
By organization size, the Asia Pacific photonic design automation market photonic design automation market is bifurcated into SMEs and large enterprises. The large enterprises segment held a larger share in 2022.
In terms of application, the Asia Pacific photonic design automation market photonic design automation market is bifurcated into academic research and industrial research & manufacturing. The industrial research & manufacturing segment held a larger share in 2022.
Based on country, the Asia Pacific photonic design automation market is categorized into Taiwan, China, Japan, South Korea, and the Rest of Asia Pacific. China dominated the Asia Pacific photonic design automation market in 2022.
Optiwave Systems Inc, Luceda Photonics, Cadence Design Systems Inc, Siemens AG, and Synopsys Inc are some of the leading companies operating in the Asia Pacific photonic design automation market.
Asia Pacific Photonic Design Automation Market Strategic Insights
Get more information on this report
Asia Pacific Photonic Design Automation Market Segmentation Analysis
Asia Pacific Photonic Design Automation Market Report Highlights
Asia Pacific Photonic Design Automation Report Scope
Report Attribute
Details
Market size in 2022
US$ 458.84 Million
Market Size by 2030
US$ 1,421.68 Million
CAGR (2022 - 2030)
15.2%
Historical Data
2020-2021
Forecast period
2023-2030
Segments Covered
By Component
Solution and Service
By Deployment
On-Premise
Cloud
By Application
Academic Research and Industrial Research & Manufacturing
Regions and Countries Covered
Asia-Pacific
China, India, Japan, Australia, Rest of Asia-Pacific
Market leaders and key company profiles
Optiwave Systems Inc
Luceda Photonics
Cadence Design Systems Inc
Siemens AG
Synopsys Inc
Get more information on this report
Asia Pacific Photonic Design Automation Market Country and Regional Insights
Get more information on this report
Identical Market Reports with other Region/Countries
The List of Companies - Asia Pacific Photonic Design Automation Market
1. Optiwave Systems Inc2. Luceda Photonics3. Cadence Design Systems Inc4. Siemens AG5. Synopsys Inc
About Author— Technology, Media and Telecommunications Research Team
Siddhika is an experienced market research professional with over five years of expertise in delivering actionable market intelligence and strategic insights to support business growth and decision-making. She has strong experience in designing and managing end-to-end research engagements, including research planning, data collection, and insight generation.
Proficient in research methodologies, Siddhika synthesizes diverse information sources to deliver accurate, high-quality insights and strategic recommendations. She excels at translating complex market information into strategic narratives that support executive decision-making..
Show More
Frequently Asked Questions
How big is the Asia Pacific Photonic Design Automation Market?
The Asia Pacific Photonic Design Automation Market is valued at US$ 458.84 Million in 2022, it is projected to reach US$ 1,421.68 Million by 2030.
What is the CAGR for Asia Pacific Photonic Design Automation Market by (2022 - 2030)?
As per our report Asia Pacific Photonic Design Automation Market, the market size is valued at US$ 458.84 Million in 2022, projecting it to reach US$ 1,421.68 Million by 2030. This translates to a CAGR of approximately 15.2% during the forecast period.
What segments are covered in this report?
The Asia Pacific Photonic Design Automation Market report typically cover these key segments-
Component (Solution and Service)
Deployment (On-Premise, Cloud)
Application (Academic Research and Industrial Research & Manufacturing)
What is the historic period, base year, and forecast period taken for Asia Pacific Photonic Design Automation Market?
The historic period, base year, and forecast period can vary slightly depending on the specific market research report. However, for the Asia Pacific Photonic Design Automation Market report:
Historic Period : 2020-2021
Base Year : 2022
Forecast Period : 2023-2030
Who are the major players in Asia Pacific Photonic Design Automation Market?
The Asia Pacific Photonic Design Automation Market is populated by several key players, each contributing to its growth and innovation. Some of the major players include:
Optiwave Systems Inc
Luceda Photonics
Cadence Design Systems Inc
Siemens AG
Synopsys Inc
Who should buy this report?
The Asia Pacific Photonic Design Automation Market report is valuable for diverse stakeholders, including:
Investors: Provides insights for investment decisions pertaining to market growth, companies, or industry insights. Helps assess market attractiveness and potential returns.
Industry Players: Offers competitive intelligence, market sizing, and trend analysis to inform strategic planning, product development, and sales strategies.
Suppliers and Manufacturers: Helps understand market demand for components, materials, and services related to concerned industry.
Researchers and Consultants: Provides data and analysis for academic research, consulting projects, and market studies.
Financial Institutions: Helps assess risks and opportunities associated with financing or investing in the concerned market.
Essentially, anyone involved in or considering involvement in the Asia Pacific Photonic Design Automation Market value chain can benefit from the information contained in a comprehensive market report.


 Get Free Sample For Asia Pacific Photonic Design Automation Market


