Prévisions du marché des produits chimiques miniers en Asie-Pacifique jusqu’en 2030 – Analyse régionale – par type [produits chimiques de flottation (mousseurs, floculants, dépresseurs, collecteurs et autres), solvants d’extraction, auxiliaires de broyage et autres], type de minéraux (métaux de base, minéraux non métalliques , métaux précieux et autres) et application (traitement des minéraux, traitement des eaux usées et autres)

BMIRE00030199 | Pages: 132 | Chemicals and Materials | Jun 2024 | Type: Regional | Status: Published
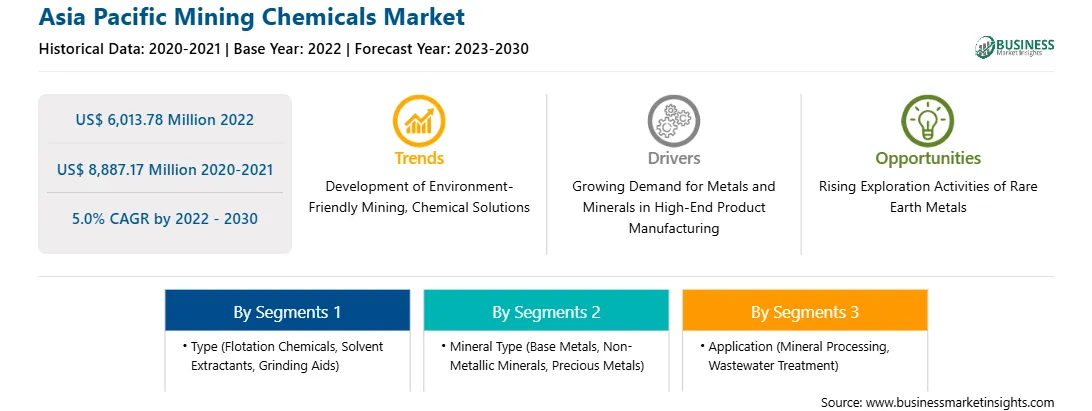
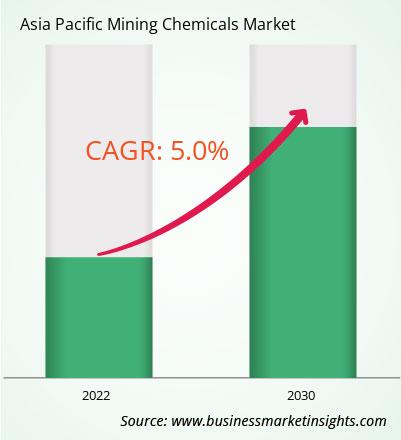
Le marché des produits chimiques miniers en Asie-Pacifique était évalué à 6 013,78 millions de dollars américains en 2022 et devrait atteindre 8 887,17 millions de dollars américains d’ici 2030 ; on estime qu\'il s\'enregistrera à un TCAC de 5,0 % de 2022 à 2030.

L\'augmentation des investissements et des opérations dans le secteur minier mondial stimule le marché des produits chimiques miniers en Asie-Pacifique

L\'augmentation des activités minières dans le monde a entraîné dans la demande croissante de produits chimiques miniers. En outre, l’adoption de technologies minières avancées, telles que l’automatisation et la numérisation, améliore l’efficacité et la durabilité environnementale des opérations minières à l’échelle mondiale. Selon la Banque mondiale, la production de graphite, de lithium et de cobalt devrait augmenter d\'environ 500 % d\'ici 2050 pour répondre à la demande croissante de technologies énergétiques propres.

La région connaît une augmentation des activités minières en raison de la découverte de nouveaux gisements minéraux, du développement croissant des infrastructures et de la demande croissante de minéraux et de ressources. Les gouvernements et les organisations de pays comme l’Australie, la Chine, la République tchèque, le Portugal, les États-Unis, le Canada et d’autres promeuvent activement les activités d’exploration et d’exploitation minière. Selon un rapport du Green Finance and Development Centre, les investissements dans les industries métallurgiques et minières en Chine ont atteint 10 milliards de dollars au premier semestre 2023, soit une augmentation de 131 % par rapport à la même période en 2022. En 2023, le gouvernement australien a investi 3,9 milliards de dollars supplémentaires dans la facilité pour les minéraux critiques gérée par Export Finance Australia. Le financement visait à soutenir des projets miniers alignés sur la stratégie australienne relative aux minéraux critiques 2023-2030. Les activités d’expansion et l’augmentation des investissements dans le secteur minier stimulent la demande de produits chimiques miniers.

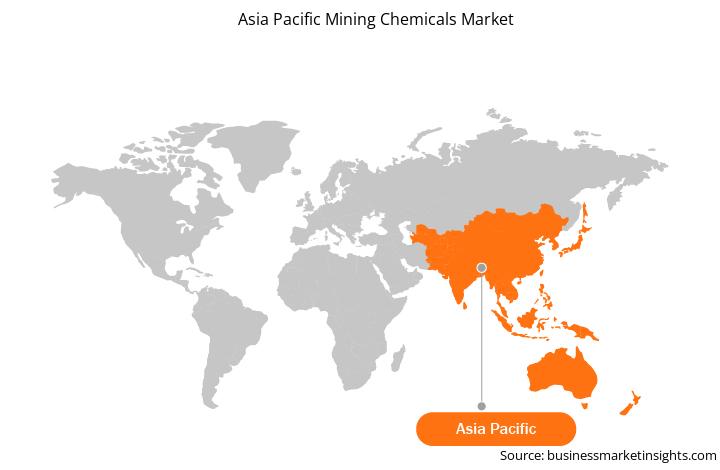
Aperçu du marché des produits chimiques miniers en Asie-Pacifique

L\'Asie-Pacifique marque la présence de grandes sociétés minières telles que Mitsubishi Materials Corporation, Jiangxi Copper Co Ltd, Aluminum Corporation of China Ltd, Coal India Limited, China Molybdenum. Co Ltd, BHP et autres. L\'Asie-Pacifique compte 10 grands projets d\'exploitation minière à ciel ouvert : mine verte (Chine), mine Sangatta (Indonésie), mine Heidaigou (Chine), mine de cuivre-or Oyu Tolgoi (Mongolie), mine Gevra OC (Inde), mine de cuivre Letpadaung (Myanmar) , mine Li (Thaïlande), projet FTB (Thaïlande) et mine Pasir (Indonésie). Selon le rapport publié par l\'US Geological Survey en 2022, la Chine était le plus grand fournisseur de 25 minéraux non combustibles de plusieurs pays du monde en 2021. De plus, la Chine est le producteur de 16 minéraux critiques sur les 25 minéraux répertoriés. Selon une étude menée par l\'Institut norvégien des affaires internationales en 2022, l\'Asie centrale a enregistré une présence de 38,6 % des réserves mondiales de minerai de manganèse, 30,07 % de chrome, 20 % de plomb, 12,6 % de zinc, 8,7 % de titane, 5,8 %. d\'aluminium et 5,3% de cuivre.

La Chine, le Tadjikistan, l\'Australie, le Vietnam et d\'autres pays représentent une production et des réserves minières majeures d\'antimoine dans le monde. Selon le rapport World Mining Data 2022 publié par le ministère fédéral de la République d\'Autriche, le taux de production minière de minéraux en Australie a enregistré une augmentation de 142,2 % entre 2000 et 2020. Selon l\'Agence internationale de l\'énergie, les entreprises chinoises ont doublé leurs investissements dans l\'exploration minière critique, en particulier dans les projets de lithium. La demande de produits chimiques miniers est directement proportionnelle aux opérations minières et aux activités d’exploration minière dans la région. Par conséquent, la croissance des opérations minières renforce la demande de produits chimiques miniers en Asie-Pacifique.

Revenus et prévisions du marché des produits chimiques miniers en Asie-Pacifique jusqu\'en 2030 (millions de dollars américains)

Segmentation du marché des produits chimiques miniers en Asie-Pacifique

Le marché des produits chimiques miniers en Asie-Pacifique est segmenté en fonction du type , type de minéral, application et pays.

En termes de type, le marché des produits chimiques miniers de l\'Asie-Pacifique est segmenté en produits chimiques de flottation, solvants d\'extraction, aides au broyage et autres. Le segment des produits chimiques de flottation est sous-segmenté en mousseurs, floculants, dépresseurs, collecteurs et autres. Le segment des produits chimiques de flottation détenait la plus grande part en 2022.

Par type de minéral, le marché des produits chimiques miniers de l\'Asie-Pacifique est segmenté en métaux de base, minéraux non métalliques, métaux précieux et autres. Le segment des minéraux non métalliques détenait la plus grande part en 2022.

En termes d\'application, le marché des produits chimiques miniers de l\'Asie-Pacifique est segmenté en traitement des minéraux, traitement des eaux usées et autres. Le segment du traitement des minéraux détenait la plus grande part en 2022.

En fonction des pays, le marché des produits chimiques miniers de l\'Asie-Pacifique est classé en Australie, Chine, Inde, Japon, Corée du Sud et reste de l\'Asie-Pacifique. La Chine a dominé le marché des produits chimiques miniers en Asie-Pacifique en 2022.

Orica Ltd, Kemira Oyj, BASF SE, Clariant AG, Dow Inc, AECI Ltd, Nouryon Chemicals Holding BV, Solvay SA et Arkema SA font partie des sociétés leaders opérant sur le marché des produits chimiques miniers en Asie-Pacifique.

Table of Content


1. Introduction

1.1 The Insight Partners Research Report Guidance

1.2 Market Segmentation

2. Executive Summary

2.1 Key Insights

2.2 Market Attractiveness

2.2.1 Market Attractiveness

3. Research Methodology

3.1 Coverage

3.2 Secondary Research

3.3 Primary Research

4. Asia Pacific Mining Chemicals Market Landscape

4.1 Overview

4.2 Porter's Five Forces Analysis

4.2.1 Bargaining Power of Suppliers

4.2.2 Bargaining Power of Buyers

4.2.3 Threat of New Entrants

4.2.4 Competitive Rivalry

4.2.5 Threat of Substitutes

4.3 Ecosystem Analysis

4.3.1 Raw Material Suppliers:

4.3.2 Manufacturers:

4.3.3 Distributors or Suppliers:

4.3.4 End Use Industry:

4.4 List of Vendors in the Value Chain

5. Asia Pacific Mining Chemicals Market - Key Market Dynamics

5.1 Market Drivers

5.1.1 Growing Demand for Metals and Minerals in High-End Product Manufacturing

5.1.2 Increasing Investments and Operations in Global Mining Sector

5.2 Market Restraints

5.2.1 Stringent Government Regulations Related to Hazardous Mining Chemicals

5.3 Market Opportunities

5.3.1 Rising Exploration Activities of Rare Earth Metals

5.4 Future Trends

5.4.1 Development of Environment-Friendly Mining Chemical Solutions

5.5 Impact Analysis

6. Mining Chemicals Market - Asia Pacific Market Analysis

6.1 Asia Pacific Mining Chemicals Market Revenue (US$ Million), 2022 - 2030

6.2 Asia Pacific Mining Chemicals Market Forecast and Analysis

7. Asia Pacific Mining Chemicals Market Analysis - Type

7.1 Flotation Chemicals

7.1.1 Overview

7.1.2 Flotation Chemicals Market Revenue and Forecast to 2030 (US$ Million)

7.1.2.1 Flotation Chemicals Market Volume and Forecast to 2030 (Kilo tons)

7.1.3 Frothers

7.1.3.1 Overview

7.1.3.2 Frothers Market Revenue and Forecast to 2030 (US$ Million)

7.1.3.3 Frothers Market Volume and Forecast to 2030 (Kilo tons)

7.1.4 Flocculants

7.1.4.1 Overview

7.1.4.2 Flocculants Market Revenue and Forecast to 2030 (US$ Million)

7.1.4.3 Flocculants Market Volume and Forecast to 2030 (Kilo tons)

7.1.5 Depressants

7.1.5.1 Overview

7.1.5.2 Depressants Market Revenue and Forecast to 2030 (US$ Million)

7.1.5.3 Depressants Market Volume and Forecast to 2030 (Kilo tons)

7.1.6 Collectors

7.1.6.1 Overview

7.1.6.2 Collectors Market Revenue and Forecast to 2030 (US$ Million)

7.1.6.3 Collectors Market Volume and Forecast to 2030 (Kilo tons)

7.1.7 Others

7.1.7.1 Overview

7.1.7.2 Others Market Revenue and Forecast to 2030 (US$ Million)

7.1.7.3 Others Market Volume and Forecast to 2030 (Kilo tons)

7.2 Solvent Extractants

7.2.1 Overview

7.2.1.1 Solvent Extractants Market Revenue and Forecast to 2030 (US$ Million)

7.2.1.2 Solvent Extractants Market Volume and Forecast to 2030 (Kilo tons)

7.3 Grinding Aids

7.3.1 Overview

7.3.1.1 Grinding Aids Market Revenue and Forecast to 2030 (US$ Million)

7.3.1.2 Grinding Aids Market Volume and Forecast to 2030 (Kilo tons)

7.4 Others

7.4.1 Overview

7.4.1.1 Others Market Revenue and Forecast to 2030 (US$ Million)

7.4.1.2 Others Market Volume and Forecast to 2030 (Kilo tons)

8. Asia Pacific Mining Chemicals Market Analysis - Mineral Type

8.1 Base Metals

8.1.1 Overview

8.1.1.1 Base Metals Market Revenue and Forecast to 2030 (US$ Million)

8.2 Non-Metallic Minerals

8.2.1 Overview

8.2.1.1 Non-metallic minerals Market Revenue and Forecast to 2030 (US$ Million)

8.3 Precious Metals

8.3.1 Overview

8.3.1.1 Precious Metals Market Revenue and Forecast to 2030 (US$ Million)

8.4 Others

8.4.1 Overview

8.4.1.1 Others Market Revenue and Forecast to 2030 (US$ Million)

9. Asia Pacific Mining Chemicals Market Analysis - Application

9.1 Mineral Processing

9.1.1 Overview

9.1.1.1 Mineral Processing Market Revenue and Forecast to 2030 (US$ Million)

9.2 Wastewater Treatment

9.2.1 Overview

9.2.1.1 Wastewater Treatment Market Revenue and Forecast to 2030 (US$ Million)

9.3 Others

9.3.1 Overview

9.3.1.1 Others Market Revenue and Forecast to 2030 (US$ Million)

10. Asia Pacific Mining Chemicals Market - Country Analysis

10.1.1 Asia Pacific Mining Chemicals Market Revenue and Forecasts and Analysis - By Countries

10.1.1.1 Mining Chemicals market Breakdown by Country

10.1.1.2 Australia Mining Chemicals Market Volume and Forecasts to 2030 (Kilo tons)

10.1.1.3 Australia Mining Chemicals Market Revenue and Forecasts to 2030 (US$ Million)

10.1.1.3.1 Australia Mining Chemicals Market Breakdown by Type

10.1.1.3.2 Australia Mining Chemicals Market Breakdown by Type

10.1.1.3.3 Australia Mining Chemicals Market Breakdown by Mineral Type

10.1.1.3.4 Australia Mining Chemicals Market Breakdown by Application

10.1.1.4 China Mining Chemicals Market Volume and Forecasts to 2030 (Kilo tons)

10.1.1.5 China Mining Chemicals Market Revenue and Forecasts to 2030 (US$ Million)

10.1.1.5.1 China Mining Chemicals Market Breakdown by Type

10.1.1.5.2 China Mining Chemicals Market Breakdown by Type

10.1.1.5.3 China Mining Chemicals Market Breakdown by Mineral Type

10.1.1.5.4 China Mining Chemicals Market Breakdown by Application

10.1.1.6 India Mining Chemicals Market Volume and Forecasts to 2030 (Kilo tons)

10.1.1.7 India Mining Chemicals Market Revenue and Forecasts to 2030 (US$ Million)

10.1.1.7.1 India Mining Chemicals Market Breakdown by Type

10.1.1.7.2 India Mining Chemicals Market Breakdown by Type

10.1.1.7.3 India Mining Chemicals Market Breakdown by Mineral Type

10.1.1.7.4 India Mining Chemicals Market Breakdown by Application

10.1.1.8 Japan Mining Chemicals Market Volume and Forecasts to 2030 (Kilo tons)

10.1.1.9 Japan Mining Chemicals Market Revenue and Forecasts to 2030 (US$ Million)

10.1.1.9.1 Japan Mining Chemicals Market Breakdown by Type

10.1.1.9.2 Japan Mining Chemicals Market Breakdown by Type

10.1.1.9.3 Japan Mining Chemicals Market Breakdown by Mineral Type

10.1.1.9.4 Japan Mining Chemicals Market Breakdown by Application

10.1.1.10 South Korea Mining Chemicals Market Volume and Forecasts to 2030 (Kilo tons)

10.1.1.11 South Korea Mining Chemicals Market Revenue and Forecasts to 2030 (US$ Million)

10.1.1.11.1 South Korea Mining Chemicals Market Breakdown by Type

10.1.1.11.2 South Korea Mining Chemicals Market Breakdown by Type

10.1.1.11.3 South Korea Mining Chemicals Market Breakdown by Mineral Type

10.1.1.11.4 South Korea Mining Chemicals Market Breakdown by Application

10.1.1.12 Rest of Asia Pacific Mining Chemicals Market Volume and Forecasts to 2030 (Kilo tons)

10.1.1.13 Rest of Asia Pacific Mining Chemicals Market Revenue and Forecasts to 2030 (US$ Million)

10.1.1.13.1 Rest of Asia Pacific Mining Chemicals Market Breakdown by Type

10.1.1.13.2 Rest of Asia Pacific Mining Chemicals Market Breakdown by Type

10.1.1.13.3 Rest of Asia Pacific Mining Chemicals Market Breakdown by Mineral Type

10.1.1.13.4 Rest of Asia Pacific Mining Chemicals Market Breakdown by Application

11. Industry Landscape

11.1 Overview

11.2 Product launch

11.3 Other Strategies and Developments

12. Company Profiles

12.1 Orica Ltd

12.1.1 Key Facts

12.1.2 Business Description

12.1.3 Products and Services

12.1.4 Financial Overview

12.1.5 SWOT Analysis

12.1.6 Key Developments

12.2 Kemira Oyj

12.2.1 Key Facts

12.2.2 Business Description

12.2.3 Products and Services

12.2.4 Financial Overview

12.2.5 SWOT Analysis

12.2.6 Key Developments

12.3 BASF SE

12.3.1 Key Facts

12.3.2 Business Description

12.3.3 Products and Services

12.3.4 Financial Overview

12.3.5 SWOT Analysis

12.3.6 Key Developments

12.4 Clariant AG

12.4.1 Key Facts

12.4.2 Business Description

12.4.3 Products and Services

12.4.4 Financial Overview

12.4.5 SWOT Analysis

12.4.6 Key Developments

12.5 Dow Inc

12.5.1 Key Facts

12.5.2 Business Description

12.5.3 Products and Services

12.5.4 Financial Overview

12.5.5 SWOT Analysis

12.5.6 Key Developments

12.6 AECI Ltd

12.6.1 Key Facts

12.6.2 Business Description

12.6.3 Products and Services

12.6.4 Financial Overview

12.6.5 SWOT Analysis

12.6.6 Key Developments

12.7 Nouryon Chemicals Holding BV

12.7.1 Key Facts

12.7.2 Business Description

12.7.3 Products and Services

12.7.4 Financial Overview

12.7.5 SWOT Analysis

12.7.6 Key Developments

12.8 Solvay SA

12.8.1 Key Facts

12.8.2 Business Description

12.8.3 Products and Services

12.8.4 Financial Overview

12.8.5 SWOT Analysis

12.8.6 Key Developments

12.9 Arkema SA

12.9.1 Key Facts

12.9.2 Business Description

12.9.3 Products and Services

12.9.4 Financial Overview

12.9.5 SWOT Analysis

12.9.6 Key Developments

13. Appendix

?

List of Tables

Table 1. Asia Pacific Mining Chemicals Market Segmentation

Table 2. List of Raw Material Suppliers

Table 3. Asia Pacific Mining Chemicals Market Revenue and Forecasts to 2030 (US$ Million)

Table 4. Asia Pacific Mining Chemicals Market Volume and Forecasts to 2030 (Kilo tons) - Type

Table 5. Asia Pacific Mining Chemicals Market Revenue and Forecasts to 2030 (US$ Million) - Type

Table 6. Asia Pacific Mining Chemicals Market Revenue and Forecasts to 2030 (US$ Million) - Mineral Type

Table 7. Asia Pacific Mining Chemicals Market Revenue and Forecasts to 2030 (US$ Million) - Application

Table 8. Australia Mining Chemicals Market Volume and Forecasts to 2030 (Kilo tons) - By Type

Table 9. Australia Mining Chemicals Market Revenue and Forecasts to 2030 (US$ Million) - By Type

Table 10. Australia Mining Chemicals Market Revenue and Forecasts to 2030 (US$ Million) - By Mineral Type

Table 11. Australia Mining Chemicals Market Revenue and Forecasts to 2030 (US$ Million) - By Application

Table 12. China Mining Chemicals Market Volume and Forecasts to 2030 (Kilo tons) - By Type

Table 13. China Mining Chemicals Market Revenue and Forecasts to 2030 (US$ Million) - By Type

Table 14. China Mining Chemicals Market Revenue and Forecasts to 2030 (US$ Million) - By Mineral Type

Table 15. China Mining Chemicals Market Revenue and Forecasts to 2030 (US$ Million) - By Application

Table 16. India Mining Chemicals Market Volume and Forecasts to 2030 (Kilo tons) - By Type

Table 17. India Mining Chemicals Market Revenue and Forecasts to 2030 (US$ Million) - By Type

Table 18. India Mining Chemicals Market Revenue and Forecasts to 2030 (US$ Million) - By Mineral Type

Table 19. India Mining Chemicals Market Revenue and Forecasts to 2030 (US$ Million) - By Application

Table 20. Japan Mining Chemicals Market Volume and Forecasts to 2030 (Kilo tons) - By Type

Table 21. Japan Mining Chemicals Market Revenue and Forecasts to 2030 (US$ Million) - By Type

Table 22. Japan Mining Chemicals Market Revenue and Forecasts to 2030 (US$ Million) - By Mineral Type

Table 23. Japan Mining Chemicals Market Revenue and Forecasts to 2030 (US$ Million) - By Application

Table 24. South Korea Mining Chemicals Market Revenue and Forecasts to 2030 (US$ Million) - By Type

Table 25. South Korea Mining Chemicals Market Revenue and Forecasts to 2030 (US$ Million) - By Type

Table 26. South Korea Mining Chemicals Market Revenue and Forecasts to 2030 (US$ Million) - By Mineral Type

Table 27. South Korea Mining Chemicals Market Revenue and Forecasts to 2030 (US$ Million) - By Application

Table 28. Rest of Asia Pacific Mining Chemicals Market Volume and Forecasts to 2030 (Kilo tons) - By Type

Table 29. Rest of Asia Pacific Mining Chemicals Market Revenue and Forecasts to 2030 (US$ Million) - By Type

Table 30. Rest of Asia Pacific Mining Chemicals Market Revenue and Forecasts to 2030 (US$ Million) - By Mineral Type

Table 31. Rest of Asia Pacific Mining Chemicals Market Revenue and Forecasts to 2030 (US$ Million) - By Application

?

List of Figures

Figure 1. Asia Pacific Mining Chemicals Market Segmentation, By Country

Figure 2. Porter's Five Forces Analysis

Figure 3. Ecosystem: Asia Pacific Mining Chemicals Market

Figure 4. Asia Pacific Mining Chemicals Market Impact Analysis of Drivers and Restraints

Figure 5. Asia Pacific Mining Chemicals Market Revenue (US$ Million), 2022 - 2030

Figure 6. Asia Pacific Mining Chemicals Market Share (%) - Type, 2022 and 2030

Figure 7. Flotation Chemicals Market Revenue and Forecasts to 2030 (US$ Million)

Figure 8. Flotation Chemicals Market Volume and Forecasts to 2030 (Kilo tons)

Figure 9. Frothers Market Revenue and Forecasts to 2030 (US$ Million)

Figure 10. Frothers Market Volume and Forecasts to 2030 (Kilo tons)

Figure 11. Flocculants Market Revenue and Forecasts to 2030 (US$ Million)

Figure 12. Flocculants Market Volume and Forecasts to 2030 (Kilo tons)

Figure 13. Depressants Market Revenue and Forecasts to 2030 (US$ Million)

Figure 14. Depressants Market Volume and Forecasts to 2030 (Kilo tons)

Figure 15. Collectors Market Revenue and Forecasts to 2030 (US$ Million)

Figure 16. Collectors Market Volume and Forecasts to 2030 (Kilo tons)

Figure 17. Others Market Revenue and Forecasts to 2030 (US$ Million)

Figure 18. Others Market Volume and Forecasts to 2030 (Kilo tons)

Figure 19. Solvent Extractants Market Revenue and Forecasts to 2030 (US$ Million)

Figure 20. Solvent Extractants Market Volume and Forecasts to 2030 (Kilo tons)

Figure 21. Grinding Aids Market Revenue and Forecasts to 2030 (US$ Million)

Figure 22. Grinding Aids Market Volume and Forecasts to 2030 (Kilo tons)

Figure 23. Others Market Revenue and Forecasts to 2030 (US$ Million)

Figure 24. Others Market Volume and Forecasts to 2030 (Kilo tons)

Figure 25. Asia Pacific Mining Chemicals Market Share (%) - Mineral Type, 2022 and 2030

Figure 26. Base Metals Market Revenue and Forecasts to 2030 (US$ Million)

Figure 27. Non-Metallic Minerals Market Revenue and Forecasts to 2030 (US$ Million)

Figure 28. Precious Metals Market Revenue and Forecasts to 2030 (US$ Million)

Figure 29. Others Market Revenue and Forecasts to 2030 (US$ Million)

Figure 30. Asia Pacific Mining Chemicals Market Share (%) - Application, 2022 and 2030

Figure 31. Mineral Processing Market Revenue and Forecasts to 2030 (US$ Million)

Figure 32. Wastewater Treatment Market Revenue and Forecasts to 2030 (US$ Million)

Figure 33. Others Market Revenue and Forecasts to 2030 (US$ Million)

Figure 34. Asia Pacific Mining Chemicals Market Breakdown, by Key Countries, 2022 (US$)

Figure 35. Mining Chemicals market Breakdown by Key Countries, 2022 and 2030 (%)

Figure 36. Australia Mining Chemicals Market Volume and Forecasts to 2030 (Kilo tons)

Figure 37. Australia Mining Chemicals Market Revenue and Forecasts to 2030 (US$ Million)

Figure 38. China Mining Chemicals Market Volume and Forecasts to 2030 (Kilo tons)

Figure 39. China Mining Chemicals Market Revenue and Forecasts to 2030 (US$ Million)

Figure 40. India Mining Chemicals Market Volume and Forecasts to 2030 (Kilo tons)

Figure 41. India Mining Chemicals Market Revenue and Forecasts to 2030 (US$ Million)

Figure 42. Japan Mining Chemicals Market Volume and Forecasts to 2030 (Kilo tons)

Figure 43. Japan Mining Chemicals Market Revenue and Forecasts to 2030 (US$ Million)

Figure 44. South Korea Mining Chemicals Market Volume and Forecasts to 2030 (Kilo tons)

Figure 45. South Korea Mining Chemicals Market Revenue and Forecasts to 2030 (US$ Million)

Figure 46. Rest of Asia Pacific Mining Chemicals Market Volume and Forecasts to 2030 (Kilo tons)

Figure 47. Rest of Asia Pacific Mining Chemicals Market Revenue and Forecasts to 2030 (US$ Million)


1. Orica Ltd

2. Kemira Oyj

3. BASF SE

4. Clariant AG

5. Dow Inc

6. AECI Ltd

7. Nouryon Chemicals Holding BV

8. Solvay SA

9. Arkema SA

  • Save and reduce time carrying out entry-level research by identifying the growth, size, leading players, and segments in the Asia Pacific mining chemicals market.
  • Highlights key business priorities in order to assist companies to realign their business strategies.
  • The key findings and recommendations highlight crucial progressive industry trends in Asia Pacific mining chemicals market, thereby allowing players across the value chain to develop effective long-term strategies.
  • Develop/modify business expansion plans by using substantial growth offering developed and emerging markets.
  • Scrutinize in-depth Asia Pacific market trends and outlook coupled with the factors driving the market, as well as those hindering it.
  • Enhance the decision-making process by understanding the strategies that underpin security interest with respect to client products, segmentation, pricing, and distribution.
Report Code
Full Name
Country Name
Email Id
Phone Number
Job Title
Company
Requirement

Note : Your data will never be shared with third parties, however, we may send you information from time to time about our products that may be of interest to you. By submitting your details, you agree to be contacted by us. You may contact us at any time to opt-out.


Purchase Options
Single User License
$3550
$2840
Site License
$4550
$3640
Enterprise License
$5550
$4440