Pronóstico del mercado de tabletas resistentes de América del Sur y Central hasta 2030 – Análisis regional – por tipo (tableta totalmente resistente, tableta semirresistente y tableta ultrarresistente), sistema operativo (Android, Windows e iOS) y aplicación (aeroespacial y de defensa, automotriz) , Construcción, Energía y Servicios Públicos, Manufactura, Petróleo y Gas, y otros)
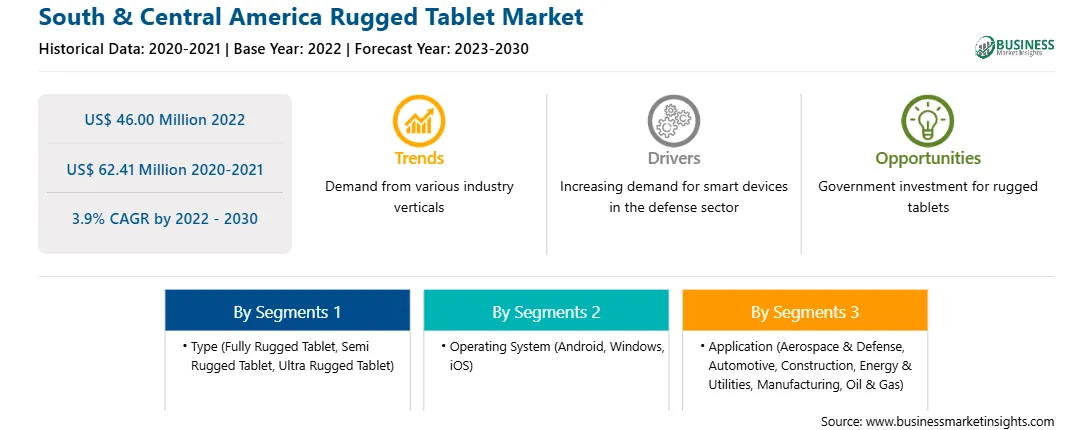
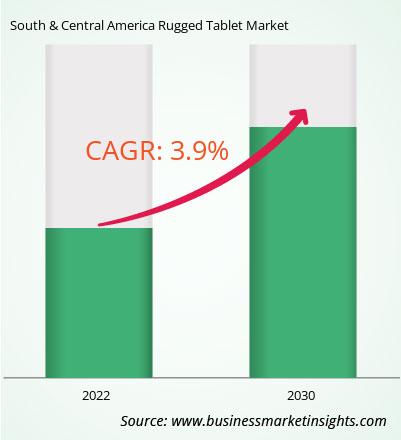
El mercado de tabletas resistentes de América del Sur y Central se valoró en 46,00 millones de dólares en 2022 y se espera que alcance los 62,41 millones de dólares en 2030; se estima que crecerá a una tasa compuesta anual del 3,9% entre 2022 y 2030.
El auge de nuevas tecnologías, como la IA y la IoT, impulsa el mercado de tabletas resistentes de América del Sur y Central
Los dispositivos habilitados para IA están por todas partes. Según Simpli Learn, la tecnología de inteligencia artificial se utiliza de una forma u otra en más del 77% de los dispositivos electrónicos actuales. Además, las tabletas robustas pueden recopilar y enviar datos de numerosos sensores y dispositivos en el campo relacionados con IoT. Estas tabletas pueden estar equipadas con software específico de recopilación y análisis de datos, lo que hace más sencillo monitorear y administrar dispositivos IoT de forma remota. Por ejemplo, se puede utilizar una tableta resistente para rastrear la ubicación de una flota de automóviles, operar maquinaria industrial y verificar los niveles de temperatura y humedad en un almacén.
Las tabletas resistentes también se pueden integrar con dispositivos de inteligencia artificial para mayor seguridad. Varias autoridades están utilizando tabletas resistentes colaboradas para la seguridad escolar, edificios gubernamentales y otros espacios públicos. Por ejemplo, en octubre de 2023, KYOCERA colaboró con tres desarrolladores de tecnología en una solución innovadora para mejorar la seguridad en escuelas, edificios gubernamentales y otros espacios públicos. la tecnología móvil ultrarresistente de Kyocera (teléfonos inteligentes y tabletas Android); Tecnología sensorial Omni-Response de 360° para una conciencia situacional óptima con un panel completo; software inteligente de detección de armas y conciencia situacional ZeroEyes AI; y las redes Cradlepoint que conectan sitios, vehículos, tecnología IoT y personal de seguridad componen la solución de seguridad escolar. Por lo tanto, se espera que el auge de nuevas tecnologías, como la IA y la IoT, ofrezca oportunidades lucrativas para el crecimiento del mercado.
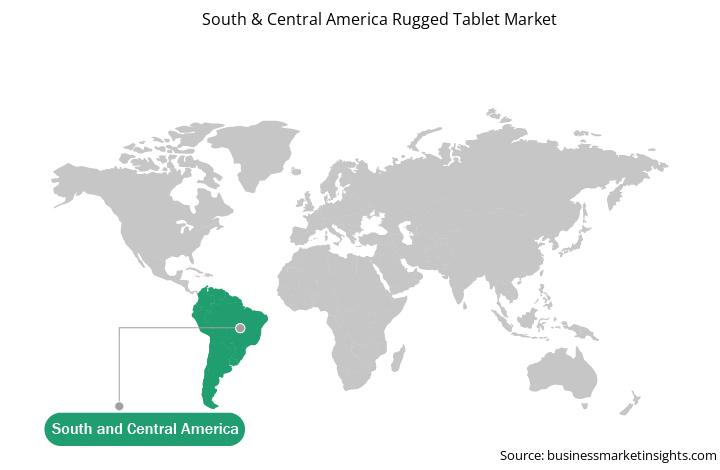
Descripción general del mercado de tabletas resistentes de América del Sur y Central
El mercado de tabletas resistentes en el resto de SAM está subsegmentado en Chile, Perú y otros. El mercado está impulsado por la creciente demanda de las industrias del transporte y la energía. El sector de infraestructura de transporte en Perú reportó avances en 2022, con inversiones por US$ 467 millones en proyectos aeroportuarios, ferroviarios, portuarios y viales en enero-noviembre de 2022. Asimismo, los aeropuertos recibieron inversiones por US$ 33,7 millones de enero a noviembre de 2022, En algunos meses se registraron inversiones por debajo del millón de dólares.
Según un informe de la firma mundial de energía renovable Mainstream Renewable Power, Chile tiene potencial para producir 44GW de energía eólica. La fuerte dependencia de Chile de las importaciones de energía ha impulsado la demanda de energía renovable. Además, los enormes aumentos en los precios de la energía debido a que los meses de verano del país dan lugar a largos períodos de sequía han impulsado la necesidad de fuentes de energía renovables producidas en el país. Las tabletas resistentes se utilizan más que las tradicionales en las industrias del transporte y la energía para guardar y transferir datos, lo que impulsa el crecimiento del mercado de tabletas resistentes en el resto de América del Sur y Central.
Ingresos y pronóstico del mercado de tabletas resistentes de América del Sur y Central hasta 2030 (millones de dólares estadounidenses)
Segmentación del mercado de tabletas resistentes de América del Sur y Central
El mercado de tabletas resistentes de América del Sur y Central está segmentado según el tipo y el sistema operativo , aplicación y país. Según el tipo, el mercado de tabletas resistentes de América del Sur y Central se segmenta en tabletas totalmente resistentes, tabletas semirresistentes y tabletas ultrarresistentes. El segmento de tabletas totalmente resistentes tuvo la mayor participación de mercado en 2022.
En términos de sistema operativo, el mercado de tabletas resistentes de América del Sur y Central se clasifica en Android, Windows e iOS. El segmento de Android tuvo la mayor participación de mercado en 2022.
Por aplicación, el mercado de tabletas resistentes de América del Sur y Central se segmenta en aeroespacial y defensa, automotriz, construcción, energía y servicios públicos, manufactura, petróleo y gas, y otros. El segmento aeroespacial y de defensa tuvo la mayor participación de mercado en 2022.
Según el país, el mercado de tabletas resistentes de América del Sur y Central está segmentado en Brasil, Argentina, Colombia y el resto de América del Sur y Central. El resto de América del Sur y Central dominó la cuota de mercado de tabletas resistentes de América del Sur y Central en 2022.
AAEON Technology Inc, Dell Technologies Inc, Panasonic Holdings Corp, Zebra Technologies Corp y Kontron AG son algunos de los principales actores que operan en el mercado de tabletas robustas de América del Sur y Central.
South & Central America Rugged Tablet Strategic Insights
Strategic insights for South & Central America Rugged Tablet involve closely monitoring industry trends, consumer behaviours, and competitor actions to identify opportunities for growth. By leveraging data analytics, businesses can anticipate market shifts and make informed decisions that align with evolving customer needs. Understanding these dynamics helps companies adjust their strategies proactively, enhance customer engagement, and strengthen their competitive edge. Building strong relationships with stakeholders and staying agile in response to changes ensures long-term success in any market.
Get more information on this report
South & Central America Rugged Tablet Report Scope
Report Attribute
Details
Market size in 2022
US$ 46.00 Million
Market Size by 2030
US$ 62.41 Million
Global CAGR (2022 - 2030)
3.9%
Historical Data
2020-2021
Forecast period
2023-2030
Segments Covered
By Tipo
Tablet totalmente resistente
Tablet semirresistente
Tablet ultra resistente
By Sistema operativo
Android
Windows
iOS
By Aplicación
aeroespacial y defensa
automoción
construcción
energÃa y servicios públicos
fabricación
petróleo y gas
Regions and Countries Covered
América del Sur y Central
Brasil
Argentina
Resto de América del Sur y Central
Market leaders and key company profiles
AAEON Technology Inc
Dell Technologies Inc
Panasonic Holdings Corp
Zebra Technologies Corp
Kontron AG
Get more information on this report
South & Central America Rugged Tablet Regional Insights
The regional scope of South & Central America Rugged Tablet refers to the geographical area in which a business operates and competes. Understanding regional nuances, such as local consumer preferences, economic conditions, and regulatory environments, is crucial for tailoring strategies to specific markets. Businesses can expand their reach by identifying underserved regions or adapting their offerings to meet regional demands. A clear regional focus allows for more effective resource allocation, targeted marketing, and better positioning against local competitors, ultimately driving growth in those specific areas.
Get more information on this report
Identical Market Reports with other Region/Countries
The List of Companies - South & Central America Rugged Tablet Market
1. AAEON Technology Inc
2. Dell Technologies Inc
3. Panasonic Holdings Corp
4. Zebra Technologies Corp
5. Kontron AG
Frequently Asked Questions
How big is the South & Central America Rugged Tablet Market?
The South & Central America Rugged Tablet Market is valued at US$ 46.00 Million in 2022, it is projected to reach US$ 62.41 Million by 2030.
What is the CAGR for South & Central America Rugged Tablet Market by (2022 - 2030)?
As per our report South & Central America Rugged Tablet Market, the market size is valued at US$ 46.00 Million in 2022, projecting it to reach US$ 62.41 Million by 2030. This translates to a CAGR of approximately 3.9% during the forecast period.
What segments are covered in this report?
The South & Central America Rugged Tablet Market report typically cover these key segments-
Tipo (Tablet totalmente resistente, Tablet semirresistente, Tablet ultra resistente)
Sistema operativo (Android, Windows, iOS)
Aplicación (aeroespacial y defensa, automoción, construcción, energía y servicios públicos, fabricación, petróleo y gas)
What is the historic period, base year, and forecast period taken for South & Central America Rugged Tablet Market?
The historic period, base year, and forecast period can vary slightly depending on the specific market research report. However, for the South & Central America Rugged Tablet Market report:
Historic Period : 2020-2021
Base Year : 2022
Forecast Period : 2023-2030
Who are the major players in South & Central America Rugged Tablet Market?
The South & Central America Rugged Tablet Market is populated by several key players, each contributing to its growth and innovation. Some of the major players include:
AAEON Technology Inc
Dell Technologies Inc
Panasonic Holdings Corp
Zebra Technologies Corp
Kontron AG
Who should buy this report?
The South & Central America Rugged Tablet Market report is valuable for diverse stakeholders, including:
Investors: Provides insights for investment decisions pertaining to market growth, companies, or industry insights. Helps assess market attractiveness and potential returns.
Industry Players: Offers competitive intelligence, market sizing, and trend analysis to inform strategic planning, product development, and sales strategies.
Suppliers and Manufacturers: Helps understand market demand for components, materials, and services related to concerned industry.
Researchers and Consultants: Provides data and analysis for academic research, consulting projects, and market studies.
Financial Institutions: Helps assess risks and opportunities associated with financing or investing in the concerned market.
Essentially, anyone involved in or considering involvement in the South & Central America Rugged Tablet Market value chain can benefit from the information contained in a comprehensive market report.
Get Free Sample For South & Central America Rugged Tablet Market
1. Complete the form
2. Check your inbox (and spam/junk folder)
3. Your Personal Data is Secure with us
GDPR + CCPA Compliant
Personal & transactional information is kept safe from unauthorized use.
WHAT'S INCLUDED IN FULL REPORT : Market Dynamics,
Competitive Analysis and Assessment, Define Business Strategies, Market Outlook and
Trends, Market Size and Share Analysis, Growth Driving Factors, Future Commercial
Potential, Identify Regional Growth Engines


 Get Free Sample For South & Central America Rugged Tablet Market

