Pronóstico del mercado de yogures no lácteos de América del Sur y Central hasta 2030 – Análisis regional – por fuente (almendra, soja, coco, avena y otros), tipo (saborizado y natural), naturaleza (orgánico y convencional) y canal de distribución (supermercados) e Hipermercados, Tiendas de Conveniencia, Comercio Minorista en Línea y Otros)
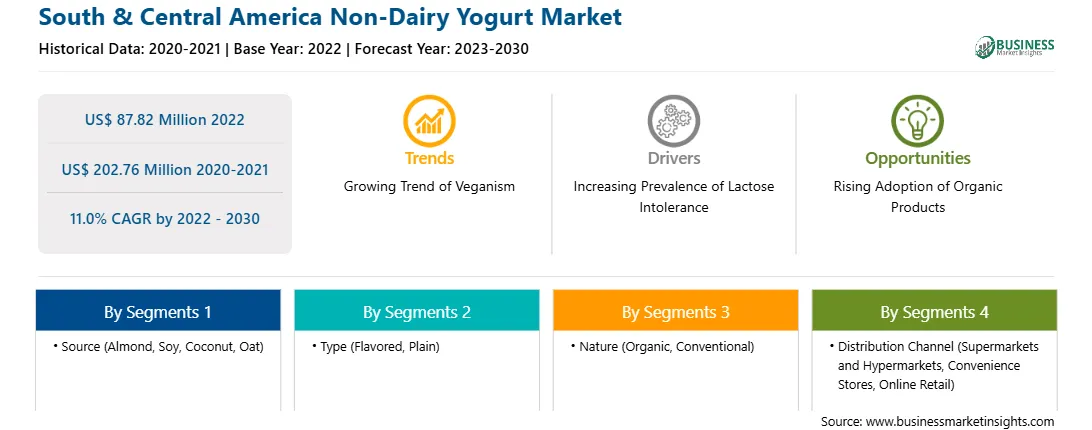
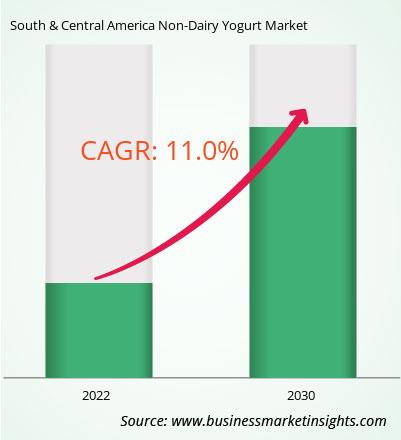
El mercado de yogures no lácteos de América del Sur y Central se valoró en 87,82 millones de dólares en 2022 y se espera que alcance los 202,76 millones de dólares en 2030; se estima que crecerá a una tasa compuesta anual del 11,0% entre 2022 y 2030.
La creciente tendencia del veganismo debido a la creciente preocupación ambiental impulsa el mercado de yogures no lácteos de América del Sur y Central
El vegano La población ha crecido significativamente en los últimos años. Según Veganuary (una organización sin fines de lucro que anima a personas de todo el mundo a volverse veganas durante todo el mes de enero), en 2022, más de 620.000 personas se registraron en la campaña Veganuary, y las inscripciones aumentaron un 200% en los últimos tres años.
La siguiente figura muestra el número de participantes en todo el mundo en la Campaña Veganuary de 2016 a 2022:
FIGURA 1. INSCRIPCIONES PARA LA CAMPAÑA VEGANUARY DE 2016 A 2022
Fuente : Revisión de la campaña Veganuary 2022
La industria ganadera es uno de los contribuyentes más importantes a las emisiones antropogénicas totales de gases de efecto invernadero. Según la Organización para la Agricultura y la Alimentación (FAO), la industria ganadera mundial emite 7,1 gigatoneladas de dióxido de carbono al año, lo que representa el 14,5% de todas las emisiones de gases de efecto invernadero causadas por el hombre. El sector lácteo es responsable del 30% del total de las emisiones ganaderas.
La siguiente figura muestra las emisiones anuales de gases de efecto invernadero por kilogramo de productos alimenticios:
FIGURA 2. EMISIONES ANUALES DE GASES DE EFECTO INVERNADERO (GEI) POR KILOGRAMO DE PRODUCTOS ALIMENTICIOS
Fuente: Poore & Nemecek, 2018
Como se puede ver en la figura anterior, la carne de vacuno (rebaño de carne), la carne de vacuno (rebaño lechero) y los productos de cordero y cordero tienen las mayores emisiones de gases de efecto invernadero. Muchos estudios han demostrado que cambiar a una dieta vegana puede reducir significativamente las emisiones de dióxido de carbono. Además, las Naciones Unidas, PETA, Good Food Institute y muchas organizaciones creen que el veganismo puede ayudar a salvar el planeta de la crisis climática. Entre los consumidores está aumentando la conciencia sobre los efectos nocivos de la industria ganadera en el medio ambiente. El consumo de productos lácteos de origen vegetal ayuda a minimizar la huella de carbono, ahorrar agua y otros recursos naturales y reducir el impacto ambiental general. Por lo tanto, los consumidores están cambiando rápidamente a productos lácteos y cárnicos de origen vegetal. Por lo tanto, la gente está cambiando cada vez más a una dieta vegana debido a las crecientes preocupaciones medioambientales y de sostenibilidad.
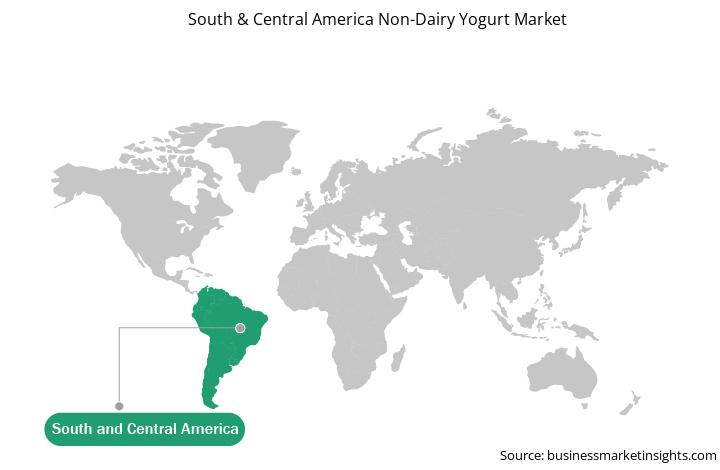
Descripción general del mercado de yogur no lácteo de América del Sur y Central
El mercado de yogur no lácteo de América del Sur y Central está segmentado en Brasil, Argentina y el resto de América del Sur y Central. Un cambio en el estilo de vida y los patrones dietéticos de los consumidores es un factor importante que impulsa el crecimiento del mercado de yogur no lácteo en América del Sur y Central, especialmente en Brasil. El aumento demográfico y las continuas mejoras tecnológicas se encuentran entre los factores que impulsan el crecimiento económico de Brasil y Argentina. Los productos lácteos de origen vegetal son una buena fuente de energía y ayudan a reducir el riesgo de enfermedades cardiovasculares. Además, el aumento de las alergias a la leche, que provocan reacciones inmunes adversas después de ingerir leche animal entre la población, especialmente en niños y bebés, es un factor importante que impulsa el crecimiento del mercado.
La intolerancia a la lactosa y la malabsorción primaria de lactosa son los síntomas más comunes de la hipolactasia (deficiencia de lactasa) de tipo adulto en Argentina, Brasil y Ecuador. Como resultado, los consumidores están optando por productos sin lácteos. Las alergias e intolerancias son las principales razones detrás del cambio hacia productos sin lácteos, especialmente considerando las estadísticas de Food Allergy Initiatives, que afirman que la alergia a la leche de vaca es la principal alergia alimentaria tanto en bebés como en adultos en América del Sur. Este factor está impulsando en gran medida la demanda de yogur no lácteo.
Ingresos y pronóstico del mercado de yogur no lácteo de América del Sur y Central hasta 2030 (millones de dólares estadounidenses)
Segmentación del mercado de yogur no lácteo de América del Sur y Central
El mercado de yogur no lácteo de América Central está segmentado según la fuente, el tipo, la naturaleza y el canal de distribución.
Según la fuente, el mercado de yogur no lácteo de América del Sur y Central está segmentado en almendras, soja, coco, avena y otros. El segmento del coco tuvo la mayor participación en 2022.
Según el tipo, el mercado de yogur no lácteo de América del Sur y Central se divide en saborizado y natural. El segmento de sabores tuvo una participación mayor en 2022.
Basado en la naturaleza, el mercado de yogur no lácteo de América del Sur y Central se divide en orgánico y convencional. El segmento convencional tuvo una participación mayor en 2022.
Según el canal de distribución, el mercado de yogur no lácteo de América del Sur y Central está segmentado en supermercados e hipermercados, tiendas de conveniencia, venta minorista en línea y otros. El segmento de supermercados e hipermercados tuvo la mayor participación en 2022.
Según el país, el mercado de yogur no lácteo de América del Sur y Central se clasifica en Brasil, Argentina y el resto de América del Sur y Central. El resto de América del Sur y Central dominó el mercado de yogur no lácteo de América del Sur y Central en 2022.
Danone SA, Cocojune Products, Forager Project, The Islandic Milk y Skyr Corporation son algunas de las empresas líderes que operan en el mercado de yogures no lácteos de América del Sur y Central.
South & Central America Non-Dairy Yogurt Strategic Insights
Strategic insights for South & Central America Non-Dairy Yogurt involve closely monitoring industry trends, consumer behaviours, and competitor actions to identify opportunities for growth. By leveraging data analytics, businesses can anticipate market shifts and make informed decisions that align with evolving customer needs. Understanding these dynamics helps companies adjust their strategies proactively, enhance customer engagement, and strengthen their competitive edge. Building strong relationships with stakeholders and staying agile in response to changes ensures long-term success in any market.
Get more information on this report
South & Central America Non-Dairy Yogurt Report Scope
Report Attribute
Details
Market size in 2022
US$ 87.82 Million
Market Size by 2030
US$ 202.76 Million
Global CAGR (2022 - 2030)
11.0%
Historical Data
2020-2021
Forecast period
2023-2030
Segments Covered
By Fuente
almendra
soja
coco
avena
By Tipo
con sabor
natural
By Naturaleza
Orgánica
Convencional
By Canal de distribución
supermercados e hipermercados
tiendas de conveniencia
venta minorista en lÃnea
Regions and Countries Covered
América del Sur y Central
Brasil
Argentina
Resto de América del Sur y Central
Market leaders and key company profiles
Danone SA
Cocojune Products
Forager Project LLC
The Icelandic Milk and Skyr Corporation
Get more information on this report
South & Central America Non-Dairy Yogurt Regional Insights
The regional scope of South & Central America Non-Dairy Yogurt refers to the geographical area in which a business operates and competes. Understanding regional nuances, such as local consumer preferences, economic conditions, and regulatory environments, is crucial for tailoring strategies to specific markets. Businesses can expand their reach by identifying underserved regions or adapting their offerings to meet regional demands. A clear regional focus allows for more effective resource allocation, targeted marketing, and better positioning against local competitors, ultimately driving growth in those specific areas.
Get more information on this report
Identical Market Reports with other Region/Countries
The List of Companies - South & Central America Non-Dairy Yogurt Market
1. Danone SA 2. Cocojune Products 3. Forager Project LLC 4. The Icelandic Milk and Skyr Corporation
Frequently Asked Questions
How big is the South & Central America Non-Dairy Yogurt Market?
The South & Central America Non-Dairy Yogurt Market is valued at US$ 87.82 Million in 2022, it is projected to reach US$ 202.76 Million by 2030.
What is the CAGR for South & Central America Non-Dairy Yogurt Market by (2022 - 2030)?
As per our report South & Central America Non-Dairy Yogurt Market, the market size is valued at US$ 87.82 Million in 2022, projecting it to reach US$ 202.76 Million by 2030. This translates to a CAGR of approximately 11.0% during the forecast period.
What segments are covered in this report?
The South & Central America Non-Dairy Yogurt Market report typically cover these key segments-
Fuente (almendra, soja, coco, avena)
Tipo (con sabor, natural)
Naturaleza (Orgánica, Convencional)
What is the historic period, base year, and forecast period taken for South & Central America Non-Dairy Yogurt Market?
The historic period, base year, and forecast period can vary slightly depending on the specific market research report. However, for the South & Central America Non-Dairy Yogurt Market report:
Historic Period : 2020-2021
Base Year : 2022
Forecast Period : 2023-2030
Who are the major players in South & Central America Non-Dairy Yogurt Market?
The South & Central America Non-Dairy Yogurt Market is populated by several key players, each contributing to its growth and innovation. Some of the major players include:
Danone SA
Cocojune Products
Forager Project LLC
The Icelandic Milk and Skyr Corporation
Who should buy this report?
The South & Central America Non-Dairy Yogurt Market report is valuable for diverse stakeholders, including:
Investors: Provides insights for investment decisions pertaining to market growth, companies, or industry insights. Helps assess market attractiveness and potential returns.
Industry Players: Offers competitive intelligence, market sizing, and trend analysis to inform strategic planning, product development, and sales strategies.
Suppliers and Manufacturers: Helps understand market demand for components, materials, and services related to concerned industry.
Researchers and Consultants: Provides data and analysis for academic research, consulting projects, and market studies.
Financial Institutions: Helps assess risks and opportunities associated with financing or investing in the concerned market.
Essentially, anyone involved in or considering involvement in the South & Central America Non-Dairy Yogurt Market value chain can benefit from the information contained in a comprehensive market report.
Get Free Sample For South & Central America Non-Dairy Yogurt Market
1. Complete the form
2. Check your inbox (and spam/junk folder)
3. Your Personal Data is Secure with us
GDPR + CCPA Compliant
Personal & transactional information is kept safe from unauthorized use.
WHAT'S INCLUDED IN FULL REPORT : Market Dynamics,
Competitive Analysis and Assessment, Define Business Strategies, Market Outlook and
Trends, Market Size and Share Analysis, Growth Driving Factors, Future Commercial
Potential, Identify Regional Growth Engines


 Get Free Sample For South & Central America Non-Dairy Yogurt Market

