Pronóstico del mercado de análisis de gasto en electrónica y semiconductores de América del Norte hasta 2030 – Análisis regional – por componente (software y servicio), tipo (análisis descriptivo, análisis predictivo y análisis prescriptivo), implementación (local y en la nube) y aplicación (financiera) Gestión, Gestión de Riesgos, Gestión de Gobernanza y Cumplimiento, Gestión de Abastecimiento y Desempeño de Proveedores, Previsión de Oferta y Demanda, y otros)
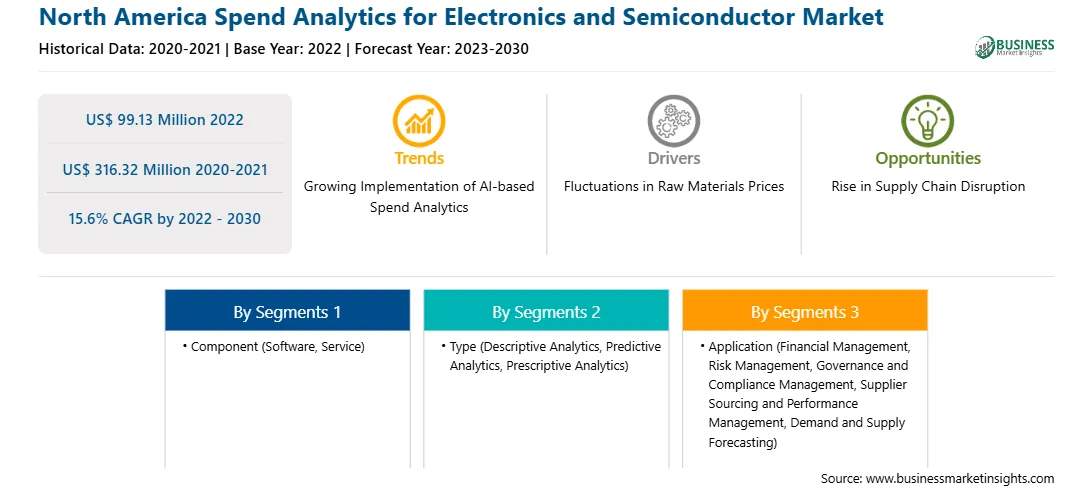
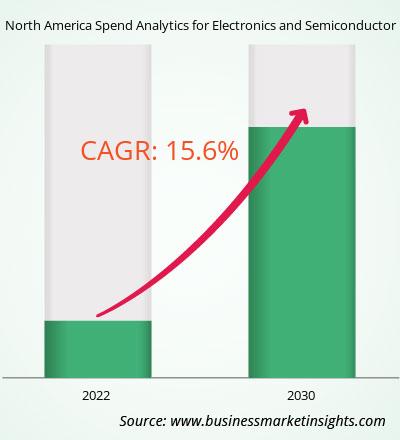
El análisis de gastos en el mercado de electrónica y semiconductores de América del Norte se valoró en 99,13 millones de dólares en 2022 y se espera que alcance los 316,32 millones de dólares en 2030; se estima que registrará una tasa compuesta anual del 15,6% entre 2022 y 2030.
Aumento de la demanda de combustibles para electrónica de consumo Análisis de gasto en América del Norte para el mercado de electrónica y semiconductores
El mercado de electrónica y semiconductores experimentó una aumento significativo de la demanda de teléfonos inteligentes, tabletas, dispositivos portátiles y otros productos electrónicos de consumo. Este aumento de la demanda puso de relieve la necesidad de realizar análisis de gastos dentro de la industria. A medida que el mercado de la electrónica de consumo se expandió, las empresas de este sector enfrentaron el desafío de administrar eficientemente sus gastos para mantener la competitividad y satisfacer las preferencias cambiantes de sus clientes. La adopción de soluciones de análisis de gastos se volvió crucial, ya que proporcionó información valiosa sobre los patrones de gasto, identificó oportunidades para la optimización de costos y facilitó la toma de decisiones informadas para garantizar que las empresas siguieran siendo adaptables y receptivas en este mercado de ritmo rápido. Además, el análisis de gastos ayuda a las empresas a optimizar sus procesos de adquisición, identificar áreas potenciales para la reducción de costos y asignar estratégicamente recursos para satisfacer la creciente demanda de productos electrónicos de consumo, lo que impulsa el análisis de gastos para el crecimiento del mercado de electrónica y semiconductores.
Descripción general del mercado de análisis de gasto en electrónica y semiconductores en América del Norte
El análisis de gasto en el mercado de electrónica y semiconductores en América del Norte está bien establecido y es maduro, y muestra un alto nivel de adopción y una sólida centrarse en aprovechar la analítica para optimizar los procesos de adquisiciones e impulsar el ahorro de costos. En particular, Estados Unidos tiene una presencia significativa en el análisis de gastos global y norteamericano en el mercado de electrónica y semiconductores. IBM Corporation, Lytica Inc, SAP y Zycus se encuentran entre los actores establecidos que operan en los EE. UU. que ofrecen soluciones analíticas sofisticadas adaptadas a las necesidades de las organizaciones de sus clientes. Estos actores tienen un profundo conocimiento de la dinámica del mercado y brindan herramientas de análisis integrales que permiten a las empresas obtener percepciones valiosas de sus patrones de gasto y tomar decisiones informadas, lo que contribuye aún más al crecimiento del análisis de gastos para el mercado de electrónica y semiconductores. En junio de 2023, Kearney, una firma de consultoría de gestión global, lideró la ronda de inversión para Simfoni, recaudando un monto de inversión de ~US$ 8 millones. Simfoni (con sede en San Francisco) ofrece soluciones para análisis de gastos, abastecimiento electrónico y gestión de gastos finales. Esta ronda de inversión, conocida como Serie A-2, significa la confianza y el apoyo de Kearney en las ofertas de Simfoni y el potencial de crecimiento en el análisis de gastos para el mercado de electrónica y semiconductores.
Ingresos del mercado de análisis de gasto en electrónica y semiconductores de América del Norte y pronóstico hasta 2030 (millones de dólares estadounidenses)
Segmentación del mercado de análisis de gasto en electrónica y semiconductores de América del Norte
América del Norte El análisis de gastos en el mercado de electrónica y semiconductores está segmentado según el componente, el tipo, la implementación, la aplicación y el país. Según los componentes, el análisis de gastos de América del Norte para el mercado de electrónica y semiconductores se divide en software y servicios. Los servicios de software tuvieron una mayor participación de mercado en 2022.
Según el tipo, el análisis de gastos de América del Norte para el mercado de electrónica y semiconductores se segmenta en análisis descriptivo, análisis predictivo y análisis prescriptivo. El análisis predictivo tuvo la mayor participación de mercado en 2022.
En términos de implementación, el análisis de gastos de América del Norte para el mercado de electrónica y semiconductores se divide en local y en la nube. La nube tuvo una mayor participación de mercado en 2022.
Por aplicación, el análisis de gastos en el mercado de electrónica y semiconductores de América del Norte se segmenta en gestión financiera, gestión de riesgos, gestión de gobernanza y cumplimiento, abastecimiento de proveedores y gestión del desempeño, y demanda. y previsión de suministro, entre otros. La gestión del desempeño y abastecimiento de proveedores tuvo la mayor participación de mercado en 2022.
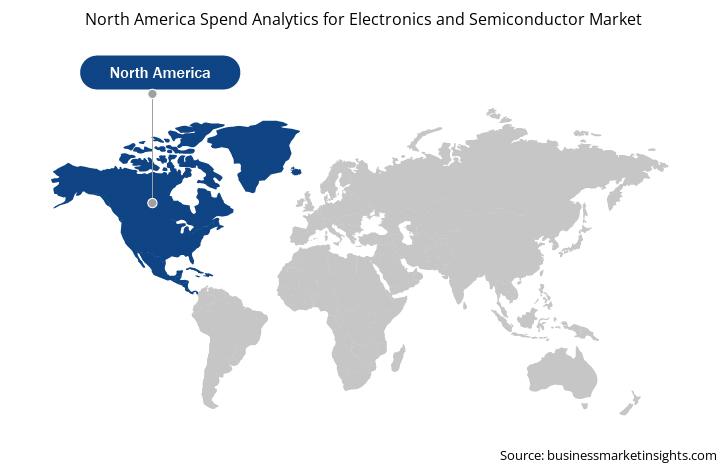
Según el país, el análisis de gastos de América del Norte para el mercado de electrónica y semiconductores está segmentado en EE. UU., Canadá y México. Estados Unidos dominó la cuota de mercado de análisis de gasto en electrónica y semiconductores de América del Norte en 2022.
Coupa Software Inc, International Business Machines Corp, Ivalua Inc, Lytica Inc, NB Ventures Inc, SAP SE, Scanmarket AS, Synertrade Inc y Zycus Inc son algunas de las empresas líderes que operan en el análisis de gastos en el mercado de electrónica y semiconductores de América del Norte.
North America Spend Analytics for Electronics and Semiconductor Strategic Insights
Strategic insights for North America Spend Analytics for Electronics and Semiconductor involve closely monitoring industry trends, consumer behaviours, and competitor actions to identify opportunities for growth. By leveraging data analytics, businesses can anticipate market shifts and make informed decisions that align with evolving customer needs. Understanding these dynamics helps companies adjust their strategies proactively, enhance customer engagement, and strengthen their competitive edge. Building strong relationships with stakeholders and staying agile in response to changes ensures long-term success in any market.
Get more information on this report
North America Spend Analytics for Electronics and Semiconductor Report Scope
Report Attribute
Details
Market size in 2022
US$ 99.13 Million
Market Size by 2030
US$ 316.32 Million
Global CAGR (2022 - 2030)
15.6%
Historical Data
2020-2021
Forecast period
2023-2030
Segments Covered
By Componente
Software
Servicio
By Tipo
Análisis descriptivo
Análisis predictivo
Análisis prescriptivo
By Aplicación
Gestión financiera
Gestión de riesgos
Gestión de gobernanza y cumplimiento
Gestión de abastecimiento y rendimiento de proveedores
Previsión de demanda y oferta
Regions and Countries Covered
América del Norte
EE. UU.
Canadá
México
Market leaders and key company profiles
Coupa Software Inc
International Business Machines Corp.
Ivalua Inc.
Lytica Inc.
NB Ventures Inc.
SAP SE.
Scanmarket AS.
Synertrade Inc.
Zycus Inc.
Get more information on this report
North America Spend Analytics for Electronics and Semiconductor Regional Insights
The regional scope of North America Spend Analytics for Electronics and Semiconductor refers to the geographical area in which a business operates and competes. Understanding regional nuances, such as local consumer preferences, economic conditions, and regulatory environments, is crucial for tailoring strategies to specific markets. Businesses can expand their reach by identifying underserved regions or adapting their offerings to meet regional demands. A clear regional focus allows for more effective resource allocation, targeted marketing, and better positioning against local competitors, ultimately driving growth in those specific areas.
Get more information on this report
Identical Market Reports with other Region/Countries
The List of Companies - North America Spend Analytics for Electronics and Semiconductor Market
1. Coupa Software Inc 2. International Business Machines Corp. 3. Ivalua Inc. 4. Lytica Inc. 5. NB Ventures Inc. 6. SAP SE. 7. Scanmarket AS. 8. Synertrade Inc. 9. Zycus Inc.
Frequently Asked Questions
How big is the North America Spend Analytics for Electronics and Semiconductor Market?
The North America Spend Analytics for Electronics and Semiconductor Market is valued at US$ 99.13 Million in 2022, it is projected to reach US$ 316.32 Million by 2030.
What is the CAGR for North America Spend Analytics for Electronics and Semiconductor Market by (2022 - 2030)?
As per our report North America Spend Analytics for Electronics and Semiconductor Market, the market size is valued at US$ 99.13 Million in 2022, projecting it to reach US$ 316.32 Million by 2030. This translates to a CAGR of approximately 15.6% during the forecast period.
What segments are covered in this report?
The North America Spend Analytics for Electronics and Semiconductor Market report typically cover these key segments-
Componente (Software, Servicio)
Tipo (Análisis descriptivo, Análisis predictivo, Análisis prescriptivo)
Aplicación (Gestión financiera, Gestión de riesgos, Gestión de gobernanza y cumplimiento, Gestión de abastecimiento y rendimiento de proveedores, Previsión de demanda y oferta)
What is the historic period, base year, and forecast period taken for North America Spend Analytics for Electronics and Semiconductor Market?
The historic period, base year, and forecast period can vary slightly depending on the specific market research report. However, for the North America Spend Analytics for Electronics and Semiconductor Market report:
Historic Period : 2020-2021
Base Year : 2022
Forecast Period : 2023-2030
Who are the major players in North America Spend Analytics for Electronics and Semiconductor Market?
The North America Spend Analytics for Electronics and Semiconductor Market is populated by several key players, each contributing to its growth and innovation. Some of the major players include:
Coupa Software Inc
International Business Machines Corp.
Ivalua Inc.
Lytica Inc.
NB Ventures Inc.
SAP SE.
Scanmarket AS.
Synertrade Inc.
Zycus Inc.
Who should buy this report?
The North America Spend Analytics for Electronics and Semiconductor Market report is valuable for diverse stakeholders, including:
Investors: Provides insights for investment decisions pertaining to market growth, companies, or industry insights. Helps assess market attractiveness and potential returns.
Industry Players: Offers competitive intelligence, market sizing, and trend analysis to inform strategic planning, product development, and sales strategies.
Suppliers and Manufacturers: Helps understand market demand for components, materials, and services related to concerned industry.
Researchers and Consultants: Provides data and analysis for academic research, consulting projects, and market studies.
Financial Institutions: Helps assess risks and opportunities associated with financing or investing in the concerned market.
Essentially, anyone involved in or considering involvement in the North America Spend Analytics for Electronics and Semiconductor Market value chain can benefit from the information contained in a comprehensive market report.
Get Free Sample For North America Spend Analytics for Electronics and Semiconductor Market
1. Complete the form
2. Check your inbox (and spam/junk folder)
3. Your Personal Data is Secure with us
GDPR + CCPA Compliant
Personal & transactional information is kept safe from unauthorized use.
WHAT'S INCLUDED IN FULL REPORT : Market Dynamics,
Competitive Analysis and Assessment, Define Business Strategies, Market Outlook and
Trends, Market Size and Share Analysis, Growth Driving Factors, Future Commercial
Potential, Identify Regional Growth Engines


 Get Free Sample For North America Spend Analytics for Electronics and Semiconductor Market

