Pronóstico del mercado de emisión de boletos inteligentes en América del Norte hasta 2031: análisis regional por componente (hardware, software y servicios), sistema de pago (sistema de pago abierto, tarjeta inteligente y NFC) y usuario final (transporte, deporte y entretenimiento, estacionamiento y otros)
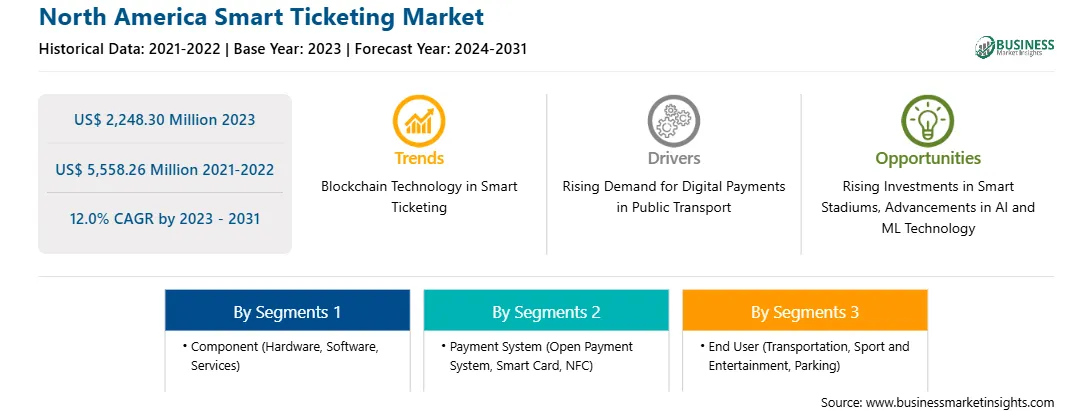
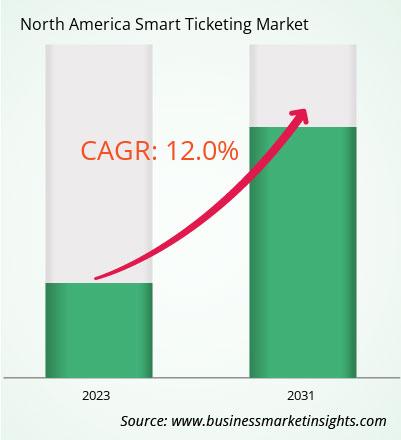
El mercado de billetes inteligentes de América del Norte se valoró en 2.248,30 millones de dólares en 2023 y se espera que alcance los 5.558,26 millones de dólares en 2031; se estima que registrará una CAGR del 12,0% entre 2023 y 2031.
La creciente demanda de pagos digitales en el transporte público impulsa el mercado de billetes inteligentes de América del Norte
Las ciudades modernas ofrecen una variedad de opciones de transporte, como autobuses, trenes y metros. Cada sistema de transporte público tiene su propio sistema de billetes. Gestionar varias tarjetas inteligentes o aplicaciones para diferentes modos de transporte puede resultar abrumador para los viajeros. Es necesario un método centralizado para combinar todas las redes de transporte. En esta dirección, se está actualizando la infraestructura de transporte público en todo el mundo. Las actualizaciones también tienen como objetivo mejorar la experiencia de los viajeros a través de una interfaz de pago perfecta. Por ejemplo, en 2024, Indra se adjudicó un contrato de 16 millones de dólares para renovar las máquinas expendedoras de billetes de Bi-State Development, la agencia pública interestatal que gestiona los servicios de transporte público en el área metropolitana de St. Louis, y MetroLink, la red de trenes ligeros de Estados Unidos en Missouri e Illinois. El contrato cubre el diseño, la producción y la entrega de máquinas expendedoras totalmente nuevas y de última generación para las 38 estaciones de la red de metro de St. Louis. Estas máquinas reemplazarán a las que están actualmente en uso y que Indra entregó anteriormente entre 2006 y 2012. Indra también se encargará del mantenimiento de las máquinas y de la implementación de un sistema de gestión basado en la nube para rastrearlas y administrarlas. A medida que las ciudades evolucionan hacia entornos inteligentes, conectados y digitales, los pagos digitales para los servicios de transporte público seguirán siendo la prioridad, impulsando así el crecimiento del mercado de billetes inteligentes.
Resumen del mercado de emisión de billetes inteligentes en Norteamérica
El mercado de emisión de billetes inteligentes en Norteamérica está experimentando un crecimiento significativo debido a los avances en la tecnología de tarjetas inteligentes que se utiliza en los sistemas de emisión de billetes inteligentes. Las soluciones sin contacto facilitadas por los teléfonos inteligentes y los dispositivos portátiles de última generación están ganando terreno de forma significativa, ya que estas soluciones ayudan a optimizar el tiempo y reducir la fricción en los mostradores de billetes físicos con opciones de pago flexibles. Los fabricantes destacados de dispositivos portátiles inteligentes, como Samsung, han introducido capacidades de pago en sus relojes inteligentes. Además, la mayoría de los fabricantes de dispositivos están integrando servicios de pago, incluidos Samsung Pay, Fitbit Pay, Apple Pay, Garmin Pay y Google Pay, en sus ofertas de billetera móvil. Si bien los pagos habilitados para relojes inteligentes aún se encuentran en la fase de desarrollo, tienen un potencial de mercado significativo. Se proyecta que estos desarrollos permitirán a los consumidores comprar billetes utilizando sus dispositivos portátiles, lo que refleja un cambio notable en el panorama de la emisión de billetes. Además, las iniciativas adoptadas por los principales actores del mercado de emisión de billetes inteligentes, como Cubic Corporation, favorecen positivamente al mercado.
Por ejemplo, en mayo de 2023, la iniciativa CALYPSO de Infineon facilitó el desarrollo de soluciones de emisión de billetes interoperables que se adhieren a estándares abiertos, lo que permite a los fabricantes adaptar las soluciones a las necesidades únicas de los operadores y las autoridades de transporte. Este enfoque elimina la dependencia de las bandas magnéticas, los códigos de barras y los billetes patentados, lo que garantiza una mayor flexibilidad y compatibilidad entre diversos sistemas. Este desarrollo representa un gran paso adelante en la modernización y expansión del sistema de emisión de billetes sin contacto en todo el estado, con planes para su implementación completa en todo el sistema ferroviario de pasajeros, seguido de los autobuses y los transbordadores.
Ingresos y pronóstico del mercado de billetes inteligentes de América del Norte hasta 2031 (millones de USD)
Segmentación del mercado de billetes inteligentes de América del Norte
El mercado de billetes inteligentes de América del Norte se clasifica en componente, sistema de pago, usuario final y país.
Según el componente, el mercado de billetes inteligentes de América del Norte se segmenta en hardware, software y servicios. El segmento de hardware tuvo la mayor participación de mercado en 2023.
Por tecnología, el mercado de boletos inteligentes de América del Norte se segmenta en sistema de pago abierto, tarjeta inteligente y NFC. El segmento de tarjeta inteligente tuvo la mayor participación de mercado en 2023.
Según el usuario final, el mercado de boletos inteligentes de América del Norte se segmenta en transporte, deporte y entretenimiento, estacionamiento y otros. El segmento de transporte tuvo la mayor participación de mercado en 2023.
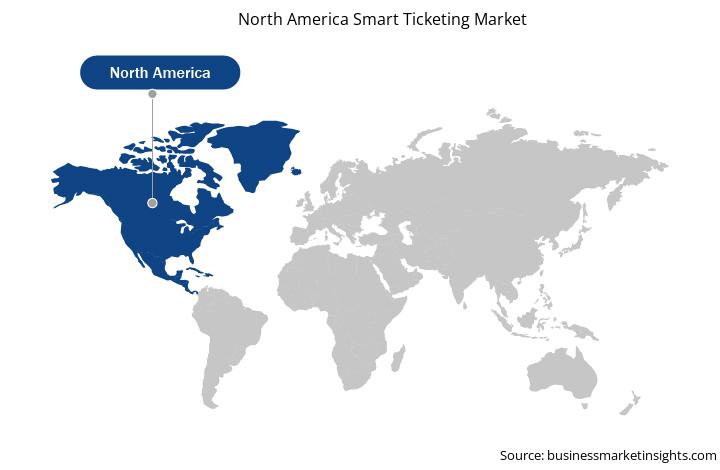
Por país, el mercado de boletos inteligentes de América del Norte se segmenta en EE. UU., Canadá y México. EE. UU. dominó la participación de mercado de boletos inteligentes de América del Norte en 2023.
Infineon Technologies AG, NXP Semiconductors NV, Xerox Holdings Corp, Cubic Corp, IDEMIA France SAS, Thales SA, Confidex, HID Global Corp y Siemens Energy AG son algunas de las empresas líderes que operan en el mercado de boletos inteligentes de América del Norte.
North America Smart Ticketing Strategic Insights
Strategic insights for North America Smart Ticketing involve closely monitoring industry trends, consumer behaviours, and competitor actions to identify opportunities for growth. By leveraging data analytics, businesses can anticipate market shifts and make informed decisions that align with evolving customer needs. Understanding these dynamics helps companies adjust their strategies proactively, enhance customer engagement, and strengthen their competitive edge. Building strong relationships with stakeholders and staying agile in response to changes ensures long-term success in any market.
Get more information on this report
North America Smart Ticketing Report Scope
Report Attribute
Details
Market size in 2023
US$ 2,248.30 Million
Market Size by 2031
US$ 5,558.26 Million
Global CAGR (2023 - 2031)
12.0%
Historical Data
2021-2022
Forecast period
2024-2031
Segments Covered
By Componente
hardware
software
servicios
By Sistema de pago
Sistema de pago abierto
Tarjeta inteligente
NFC
By Usuario final
Transporte
Deporte y Entretenimiento
Estacionamiento
Regions and Countries Covered
América del Norte
EE. UU.
Canadá
México
Market leaders and key company profiles
Infineon Technologies AG.
NXP Semiconductors NV.
Xerox Holdings Corp.
Cubic Corp.
IDEMIA France SAS.
Thales SA.
Confidex.
HID Global Corp.
Siemens Energy AG.
Get more information on this report
North America Smart Ticketing Regional Insights
The regional scope of North America Smart Ticketing refers to the geographical area in which a business operates and competes. Understanding regional nuances, such as local consumer preferences, economic conditions, and regulatory environments, is crucial for tailoring strategies to specific markets. Businesses can expand their reach by identifying underserved regions or adapting their offerings to meet regional demands. A clear regional focus allows for more effective resource allocation, targeted marketing, and better positioning against local competitors, ultimately driving growth in those specific areas.
Get more information on this report
Identical Market Reports with other Region/Countries
The List of Companies - North America Smart Ticketing Market
Infineon Technologies AG.
NXP Semiconductors NV.
Xerox Holdings Corp.
Cubic Corp.
IDEMIA France SAS.
Thales SA.
Confidex.
HID Global Corp.
Siemens Energy AG.
Frequently Asked Questions
How big is the North America Smart Ticketing Market?
The North America Smart Ticketing Market is valued at US$ 2,248.30 Million in 2023, it is projected to reach US$ 5,558.26 Million by 2031.
What is the CAGR for North America Smart Ticketing Market by (2023 - 2031)?
As per our report North America Smart Ticketing Market, the market size is valued at US$ 2,248.30 Million in 2023, projecting it to reach US$ 5,558.26 Million by 2031. This translates to a CAGR of approximately 12.0% during the forecast period.
What segments are covered in this report?
The North America Smart Ticketing Market report typically cover these key segments-
Componente (hardware, software, servicios)
Sistema de pago (Sistema de pago abierto, Tarjeta inteligente, NFC)
Usuario final (Transporte, Deporte y Entretenimiento, Estacionamiento)
What is the historic period, base year, and forecast period taken for North America Smart Ticketing Market?
The historic period, base year, and forecast period can vary slightly depending on the specific market research report. However, for the North America Smart Ticketing Market report:
Historic Period : 2021-2022
Base Year : 2023
Forecast Period : 2024-2031
Who are the major players in North America Smart Ticketing Market?
The North America Smart Ticketing Market is populated by several key players, each contributing to its growth and innovation. Some of the major players include:
Infineon Technologies AG.
NXP Semiconductors NV.
Xerox Holdings Corp.
Cubic Corp.
IDEMIA France SAS.
Thales SA.
Confidex.
HID Global Corp.
Siemens Energy AG.
Who should buy this report?
The North America Smart Ticketing Market report is valuable for diverse stakeholders, including:
Investors: Provides insights for investment decisions pertaining to market growth, companies, or industry insights. Helps assess market attractiveness and potential returns.
Industry Players: Offers competitive intelligence, market sizing, and trend analysis to inform strategic planning, product development, and sales strategies.
Suppliers and Manufacturers: Helps understand market demand for components, materials, and services related to concerned industry.
Researchers and Consultants: Provides data and analysis for academic research, consulting projects, and market studies.
Financial Institutions: Helps assess risks and opportunities associated with financing or investing in the concerned market.
Essentially, anyone involved in or considering involvement in the North America Smart Ticketing Market value chain can benefit from the information contained in a comprehensive market report.
Get Free Sample For North America Smart Ticketing Market
1. Complete the form
2. Check your inbox (and spam/junk folder)
3. Your Personal Data is Secure with us
GDPR + CCPA Compliant
Personal & transactional information is kept safe from unauthorized use.
WHAT'S INCLUDED IN FULL REPORT : Market Dynamics,
Competitive Analysis and Assessment, Define Business Strategies, Market Outlook and
Trends, Market Size and Share Analysis, Growth Driving Factors, Future Commercial
Potential, Identify Regional Growth Engines


 Get Free Sample For North America Smart Ticketing Market

