Analysis - by Type (Fully Rugged Tablet, Semi Rugged Tablet, and Ultra Rugged Tablet), Operating System (Android, Windows, and iOS), and Application (Aerospace & Defense, Automotive, Construction, Energy & Utilities, Manufacturing, Oil & Gas, and Others)
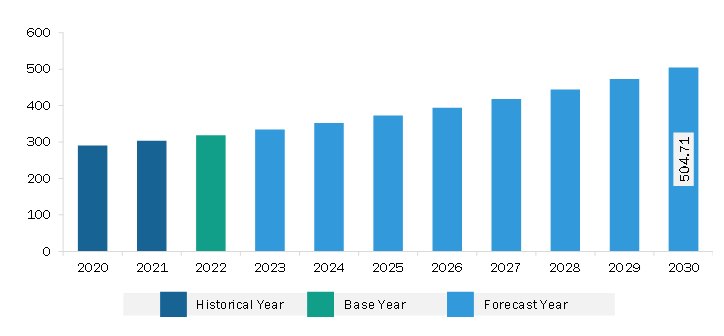
The North America rugged tablet market was valued at US$ 318.24 million in 2022 and is expected to reach US$ 504.71 million by 2030; it is estimated to grow at a CAGR of 5.9% from 2022 to 2030.
Rising Demand from Industrial Sector Fuels North America Rugged Tablet Market
The industrial sector, including manufacturing, metal fabrication, construction, and automotive, is growing year on year. In the US, the industrial production rose 0.2% YoY in August 2023. The rugged tablet has several applications in the industrial sector. A rugged tablet, also known as an industrial-grade ruggedized tablet or an industrial tablet PC, is a specialized tablet computer built to survive harsh climatic conditions and demanding operations in industrial environments. Rugged tablets are frequently used in industrial manufacturing in the roughest situations, such as on the manufacturing floor, to manage inventories, check equipment performance, and follow production schedules. They are perfect for use in demanding industrial conditions because of their strength and waterproofness, which can endure dust, debris, and liquid exposure. Ratings for durability are an essential factor in an industrial manufacturing environment.
Several players provide rugged tablets for the construction utilities manufacturing sectors. For instance, Zebra Technologies Corporation provides the Zebra Xpad l10 rugged tablet to enhance industry workflow. Thus, rising demand from the industrial sector propels the growth of the rugged tablet market.
North America Rugged Tablet Market Overview
The rugged tablet market in North America is segmented into the US, Canada, and Mexico. Among all industrial businesses, the aerospace sector in the US continues to produce the greatest trade balance (US $77.6 billion in 2019) and the second-highest volume of exports (worth US $148 billion). With growing aerospace exports at an average rate of 5.31% over the last ten years and the rising aerospace trade balance, this leading position has remained intact for decades at an average rate of 4.64% since 2010. The US Army battle command platform uses rugged tablets provided by the DRS Network & Imaging Systems LLC. Thus, growth of the aerospace & defense industry propels the US rugged tablet market growth.
Moreover, several players expand their line on rugged tablets. In January 2020, Samsung Electronics Canada declared that the Galaxy Tab Active Pro is now available in Canada. The new Galaxy Tab Active Pro, selected as an Innovation Award Honoree by the CES Event Organization, is designed for people outside the office, such as in the field, on the road, or in bad weather. Such instances boost the rugged tablet market growth in North America.
North America Rugged Tablet Market Revenue and Forecast to 2030 (US$ Million)
North America Rugged Tablet Market Segmentation
The North America rugged tablet market is segmented based on type, operating system, application, and country. Based on type, the North America rugged tablet market is segmented into fully rugged tablet, semi rugged tablet, and ultra rugged tablet. The fully rugged tablet segment held the largest market share in 2022.
In terms of operating system, the North America rugged tablet market is categorized into android, windows, and iOS. The android segment held the largest market share in 2022.
By application, the North America rugged tablet market is segmented into aerospace & defense, automotive, construction, energy & utilities, manufacturing, oil & gas, and others. The aerospace & defense segment held the largest market share in 2022.
Based on country, the North America rugged tablet market is segmented into the US, Canada, and Mexico. The US dominated the North America rugged tablet market share in 2022.
AAEON Technology Inc, Dell Technologies Inc, DT Research Inc, Panasonic Holdings Corp, Getac Holdings Corp, MilDef Group AB, NEXCOM International Co Ltd, Leonardo DRS Inc, Zebra Technologies Corp, and Kontron AG are some of the leading players operating in the North America rugged tablet market.
North America Rugged Tablet Market Strategic Insights
Get more information on this report
North America Rugged Tablet Market Segmentation Analysis
North America Rugged Tablet Market Report Highlights
North America Rugged Tablet Report Scope
Report Attribute
Details
Market size in 2022
US$ 318.24 Million
Market Size by 2030
US$ 504.71 Million
CAGR (2022 - 2030)
5.9%
Historical Data
2020-2021
Forecast period
2023-2030
Segments Covered
By Type
Fully Rugged Tablet
Semi Rugged Tablet
Ultra Rugged Tablet
By Operating System
Android
Windows
iOS
By Application
Aerospace & Defense
Automotive
Construction
Energy & Utilities
Manufacturing
Oil & Gas
Regions and Countries Covered
North America
US, Canada, Mexico
Market leaders and key company profiles
AAEON Technology Inc
Dell Technologies Inc
DT Research Inc
Panasonic Holdings Corp
Getac Holdings Corp
MilDef Group AB
NEXCOM International Co Ltd
Leonardo DRS Inc
Zebra Technologies Corp
Kontron AG
Get more information on this report
North America Rugged Tablet Market Country and Regional Insights
Get more information on this report
Identical Market Reports with other Region/Countries
The List of Companies - North America Rugged Tablet Market
1. AAEON Technology Inc 2. Dell Technologies Inc3. DT Research Inc4. Panasonic Holdings Corp5. Getac Holdings Corp6. MilDef Group AB7. NEXCOM International Co Ltd8. Leonardo DRS Inc9. Zebra Technologies Corp10. Kontron AG
Frequently Asked Questions
How big is the North America Rugged Tablet Market?
The North America Rugged Tablet Market is valued at US$ 318.24 Million in 2022, it is projected to reach US$ 504.71 Million by 2030.
What is the CAGR for North America Rugged Tablet Market by (2022 - 2030)?
As per our report North America Rugged Tablet Market, the market size is valued at US$ 318.24 Million in 2022, projecting it to reach US$ 504.71 Million by 2030. This translates to a CAGR of approximately 5.9% during the forecast period.
What segments are covered in this report?
The North America Rugged Tablet Market report typically cover these key segments-
Type (Fully Rugged Tablet, Semi Rugged Tablet, Ultra Rugged Tablet)
What is the historic period, base year, and forecast period taken for North America Rugged Tablet Market?
The historic period, base year, and forecast period can vary slightly depending on the specific market research report. However, for the North America Rugged Tablet Market report:
Historic Period : 2020-2021
Base Year : 2022
Forecast Period : 2023-2030
Who are the major players in North America Rugged Tablet Market?
The North America Rugged Tablet Market is populated by several key players, each contributing to its growth and innovation. Some of the major players include:
AAEON Technology Inc
Dell Technologies Inc
DT Research Inc
Panasonic Holdings Corp
Getac Holdings Corp
MilDef Group AB
NEXCOM International Co Ltd
Leonardo DRS Inc
Zebra Technologies Corp
Kontron AG
Who should buy this report?
The North America Rugged Tablet Market report is valuable for diverse stakeholders, including:
Investors: Provides insights for investment decisions pertaining to market growth, companies, or industry insights. Helps assess market attractiveness and potential returns.
Industry Players: Offers competitive intelligence, market sizing, and trend analysis to inform strategic planning, product development, and sales strategies.
Suppliers and Manufacturers: Helps understand market demand for components, materials, and services related to concerned industry.
Researchers and Consultants: Provides data and analysis for academic research, consulting projects, and market studies.
Financial Institutions: Helps assess risks and opportunities associated with financing or investing in the concerned market.
Essentially, anyone involved in or considering involvement in the North America Rugged Tablet Market value chain can benefit from the information contained in a comprehensive market report.


 Get Free Sample For North America Rugged Tablet Market


