Analysis - by Drug Type (Small Molecule, Large Molecule, and Vaccines), Service Type (Pre-Clinical ADME and Human Studies, PK/PD Analysis and Reporting, Dosing Simulations, Risk Analysis, and Others), Therapeutic Application (Oncology, Infectious Diseases, Neurological Disorders, Autoimmune Diseases, Gynecological Disorders, Cardiovascular Diseases, Respiratory Disorders, and Others), and End User (Pharmaceutical and Biotechnology Companies, Contract Research Organization, and Others)
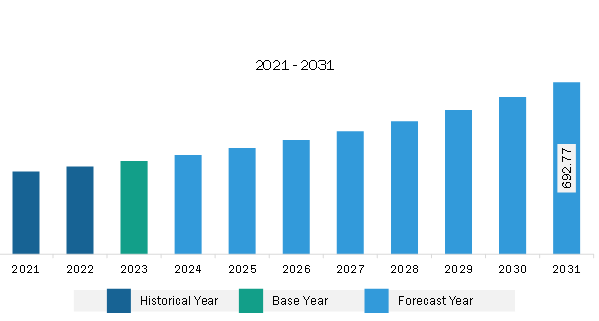
The North America pharmacokinetics services market was valued at US$ 375.36 million in 2023 and is expected to reach US$ 692.77 million by 2031; it is estimated to register a CAGR of 8.0% from 2023 to 2031.
Expanding Range of Application of Pharmacokinetic Studies Fuels North America Pharmacokinetics Services Market
Pharmacokinetic studies are being employed to determine several parameters such as human-equivalent doses (HED) level, no-observed effect level (NOEL), and pharmacokinetic/pharmacodynamic testing. The main focus of any pre-clinical program conducted is to support the analysis of a safe and effective dose range for testing in pharmacokinetic studies. Several toxicology studies conducted data on the NOEL, i.e., the highest dose that does not produce adverse effects. This dose level is further converted to a HED level on a comparative body-surface area basis if there is lack of clinical pharmacokinetic data. Understanding the pharmacokinetic profile of a potential drug candidate plays an important role in the drug discovery program. Regulatory authorities play a major role propelling the implementation of pharmacokinetic studies. These studies are also instrumental in optimizing pharmaceutical care services provided to patients admitted in hospitals. The PK model is often applied to determine exposure to drugs, concentrations of drugs to analyze optimal dosage, and analyze the disposition of drugs in the human body. Healthcare providers implement the principles of PK to design monitor drug concentrations, doses of some drugs, maximize the intended therapeutic outcomes and minimize toxicities.
North America Pharmacokinetics Services Market Overview
The US accounts for the largest share of the North America pharmacokinetics services market in North America. The country has emerged as a leading clinical research destination; it accounts for ~50% of the total clinical trials conducted in the world. The availability of established medical infrastructure, fast approval timelines, and favorable regulatory framework create a conducive environment for pharmaceutical research companies to conduct clinical trials. Moreover, the data generated in trials conducted in the US is accepted globally. As per a World Health Organization (WHO) report, the US registered the highest number of clinical trials (157,618) in 2021.
North America Pharmacokinetics Services Market Revenue and Forecast to 2031 (US$ Million)
North America Pharmacokinetics Services Market Segmentation
The North America pharmacokinetics services market is categorized into drug type, service type, therapeutic application, end user, and country.
Based on drug type, the North America pharmacokinetics services market is segmented small molecule, large molecule, and vaccines. The small molecule segment held the largest market share in 2023.
In terms of service type, the North America pharmacokinetics services market is categorized into pre-clinical ADME and human studies, PK/PD analysis and reporting, dosing simulations, risk analysis, and others. The pre-clinical ADME and human studies segment held the largest market share in 2023.
By therapeutic application, the North America pharmacokinetics services market is segmented into oncology, infectious diseases, neurological disorders, autoimmune diseases, gynaecological disorders, cardiovascular diseases, respiratory disorders, and others. The oncology segment held the largest market share in 2023.
By end user, the North America pharmacokinetics services market is segmented into pharmaceutical and biotechnology companies, contract research organization, and others. The contract research organization segment held the largest market share in 2023.
By country, the North America pharmacokinetics services market is segmented into the US, Canada, and Mexico. The US dominated the North America pharmacokinetics services market share in 2023.
Charles River Laboratories International Inc; Eurofins Scientific SE; Evotec SE; Certara Inc.; Parexel International Corp; Thermo Fisher Scientific Inc.; Allucent; PACIFIC BIOLABS; and SGS SA are some of the leading companies operating in the North America pharmacokinetics services market.
North America Pharmacokinetics Services Market Strategic Insights
Get more information on this report
North America Pharmacokinetics Services Market Segmentation Analysis
North America Pharmacokinetics Services Market Report Highlights
North America Pharmacokinetics Services Report Scope
Report Attribute
Details
Market size in 2023
US$ 375.36 Million
Market Size by 2031
US$ 692.77 Million
CAGR (2023 - 2031)
8.0%
Historical Data
2021-2022
Forecast period
2024-2031
Segments Covered
By Drug Type
Small Molecule
Large Molecule
Vaccines
By Service Type
Pre-Clinical ADME and Human Studies
PK/PD Analysis and Reporting
Dosing Simulations
Risk Analysis
By End User
Pharmaceutical and Biotechnology Companies
Contract Research Organization
Regions and Countries Covered
North America
US, Canada, Mexico
Market leaders and key company profiles
Charles River Laboratories International Inc
Eurofins Scientific SE
Evotec SE
Certara Inc.
Parexel International Corp
Thermo Fisher Scientific Inc.
Allucent
PACIFIC BIOLABS
SGS SA
Get more information on this report
North America Pharmacokinetics Services Market Country and Regional Insights
Get more information on this report
Identical Market Reports with other Region/Countries
The List of Companies - North America Pharmacokinetics Services Market
Charles River Laboratories International IncEurofins Scientific SEEvotec SECertara Inc.Parexel International CorpThermo Fisher Scientific Inc.AllucentPACIFIC BIOLABSSGS SA
Frequently Asked Questions
How big is the North America Pharmacokinetics Services Market?
The North America Pharmacokinetics Services Market is valued at US$ 375.36 Million in 2023, it is projected to reach US$ 692.77 Million by 2031.
What is the CAGR for North America Pharmacokinetics Services Market by (2023 - 2031)?
As per our report North America Pharmacokinetics Services Market, the market size is valued at US$ 375.36 Million in 2023, projecting it to reach US$ 692.77 Million by 2031. This translates to a CAGR of approximately 8.0% during the forecast period.
What segments are covered in this report?
The North America Pharmacokinetics Services Market report typically cover these key segments-
Drug Type (Small Molecule, Large Molecule, Vaccines)
Service Type (Pre-Clinical ADME and Human Studies, PK/PD Analysis and Reporting, Dosing Simulations, Risk Analysis)
End User (Pharmaceutical and Biotechnology Companies, Contract Research Organization)
What is the historic period, base year, and forecast period taken for North America Pharmacokinetics Services Market?
The historic period, base year, and forecast period can vary slightly depending on the specific market research report. However, for the North America Pharmacokinetics Services Market report:
Historic Period : 2021-2022
Base Year : 2023
Forecast Period : 2024-2031
Who are the major players in North America Pharmacokinetics Services Market?
The North America Pharmacokinetics Services Market is populated by several key players, each contributing to its growth and innovation. Some of the major players include:
Charles River Laboratories International Inc
Eurofins Scientific SE
Evotec SE
Certara Inc.
Parexel International Corp
Thermo Fisher Scientific Inc.
Allucent
PACIFIC BIOLABS
SGS SA
Who should buy this report?
The North America Pharmacokinetics Services Market report is valuable for diverse stakeholders, including:
Investors: Provides insights for investment decisions pertaining to market growth, companies, or industry insights. Helps assess market attractiveness and potential returns.
Industry Players: Offers competitive intelligence, market sizing, and trend analysis to inform strategic planning, product development, and sales strategies.
Suppliers and Manufacturers: Helps understand market demand for components, materials, and services related to concerned industry.
Researchers and Consultants: Provides data and analysis for academic research, consulting projects, and market studies.
Financial Institutions: Helps assess risks and opportunities associated with financing or investing in the concerned market.
Essentially, anyone involved in or considering involvement in the North America Pharmacokinetics Services Market value chain can benefit from the information contained in a comprehensive market report.


 Get Free Sample For North America Pharmacokinetics Services Market


