Pronóstico del mercado de tarjetas de combustible para aviación de América del Norte hasta 2030 – Análisis regional – por tipo (comercial y de marca) y aplicación (comercial y privada)
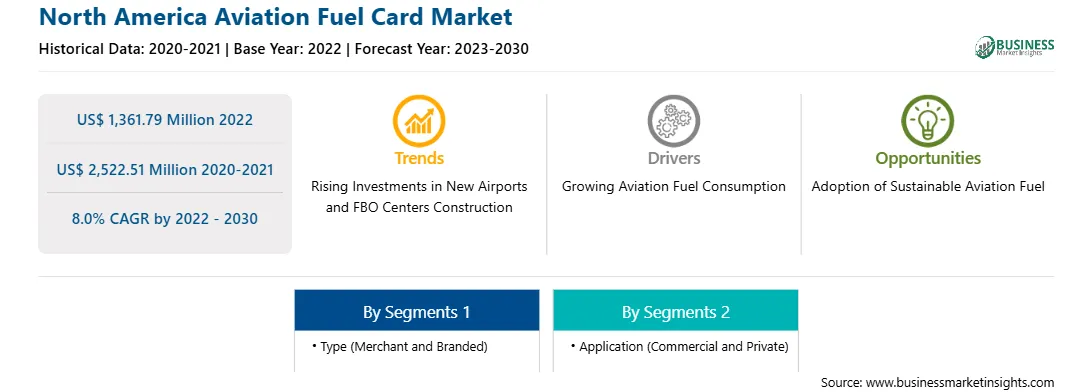
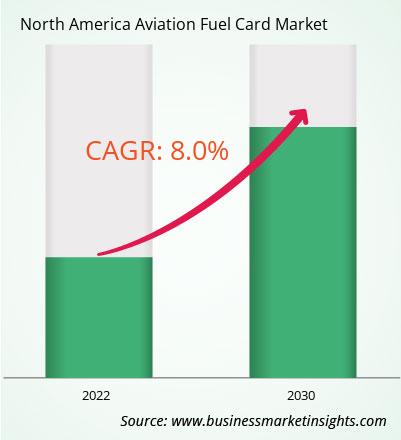
El mercado de tarjetas de combustible de aviación de América del Norte se valoró en 1.361,79 millones de dólares en 2022 y se espera que alcance los 2.522,51 millones de dólares en 2030; se estima que registrará una CAGR del 8,0% entre 2022 y 2030.
El aumento del consumo de combustible impulsa el mercado de tarjetas de combustible para aviación de América del Norte
Debido a la gran demanda de viajes aéreos, el consumo general de combustible ha aumentado. En 2022, las aerolíneas estadounidenses transportaron 194 millones de pasajeros más que en 2021, un aumento interanual del 30%. De enero a diciembre de 2022, las aerolíneas estadounidenses manejaron 853 millones de pasajeros, frente a 658 millones en 2021 y 388 millones en 2020.
Según los datos publicados por el Consejo Internacional de Transporte Limpio en 2019, en 2018, las aerolíneas nacionales en EE. UU. consumió 12,5 mil millones de galones de combustible, un aumento del 17% desde 2009. Según las previsiones proporcionadas por el Departamento de Energía de EE. UU. en 2020, se espera que el mercado mundial de combustible para aviones comerciales, que actualmente consume 106 mil millones de galones, crezca más de 230 mil millones de galones para 2050. Por lo tanto, las estadísticas anteriores indican que el consumo de combustible está aumentando con el aumento de los viajes aéreos. Históricamente, la industria de la aviación ha pagado el combustible de diversas formas, dependiendo de las condiciones económicas de la industria del combustible y de los acuerdos existentes. Las líneas aéreas y otras industrias de la aviación compran frecuentemente combustible en el mercado al contado, ya sea directamente de compañías petroleras o a través de intermediarios de combustible. Sin embargo, los métodos tradicionales son mucho más caros ya que muchas partes interesadas estuvieron presentes en el proceso. La tarjeta de combustible ha permitido a la aerolínea comprar directamente a proveedores certificados o a la empresa productora. Además, la tarjeta de combustible permite realizar un seguimiento y consumo de combustible, lo que ayuda aún más a optimizar el consumo. Por lo tanto, el aumento de los viajes aéreos ha aumentado el consumo general de combustible, lo que impulsa la adopción de tarjetas de combustible debido a diversos beneficios, como descuentos, seguimiento de costos y calidad del combustible.
Descripción general del mercado de tarjetas de combustible para aviación de América del Norte
Las naciones desarrolladas como Estados Unidos están desarrollando en gran medida combustible de aviación sostenible, lo que está generando oportunidades lucrativas para el mercado de tarjetas de combustible para aviación. Según la Oficina de Responsabilidad Gubernamental de EE. UU., en los últimos años, la producción y el uso de combustible de aviación sostenible en EE. UU. ha aumentado; Este combustible lo utilizan ahora las aerolíneas en dos importantes aeropuertos comerciales de California. Si bien Estados Unidos produjo 15,8 millones de galones en 2022, contribuyó a menos del 0,1% del combustible total para aviones utilizado por las principales aerolíneas estadounidenses. Teniendo en cuenta los estrechos márgenes y beneficios que ofrecen las tarjetas de combustible de aviación, se prevé que la adopción y el uso de tarjetas de combustible de aviación aumenten durante el período de pronóstico.
Ingresos del mercado de tarjetas de combustible para aviación de América del Norte y pronóstico hasta 2030 (millones de dólares estadounidenses)
Segmentación del mercado de tarjetas de combustible para aviación de América del Norte
El mercado de tarjetas de combustible para aviación de América del Norte se clasifica en tipo, aplicación y país.
Según el tipo, el mercado de tarjetas de combustible de aviación de América del Norte se divide en comercial y de marca. El segmento comercial tuvo una mayor participación de mercado de tarjetas de combustible de aviación en América del Norte en 2022.
En términos de aplicación, el mercado de tarjetas de combustible de aviación de América del Norte se divide en comercial y privado. El segmento comercial tuvo una mayor participación de mercado de tarjetas de combustible de aviación en América del Norte en 2022.
Por país, el mercado de tarjetas de combustible de aviación de América del Norte está segmentado en EE. UU., Canadá y México. Estados Unidos dominó la cuota de mercado de tarjetas de combustible de aviación de América del Norte en 2022.
Shell Plc, BP Plc, Associated Energy Group LLC, TITAN Aviation Fuels Inc, CSI Enterprises Inc, TotalEnergies SE, EPIC Aviation LLC, Kropp Holdings Inc, Avfuel Corp y Multi Service Corp. se encuentran entre las empresas líderes que operan en el mercado de tarjetas de combustible de aviación de América del Norte.
North America Aviation Fuel Card Strategic Insights
Strategic insights for North America Aviation Fuel Card involve closely monitoring industry trends, consumer behaviours, and competitor actions to identify opportunities for growth. By leveraging data analytics, businesses can anticipate market shifts and make informed decisions that align with evolving customer needs. Understanding these dynamics helps companies adjust their strategies proactively, enhance customer engagement, and strengthen their competitive edge. Building strong relationships with stakeholders and staying agile in response to changes ensures long-term success in any market.
Get more information on this report
North America Aviation Fuel Card Report Scope
Report Attribute
Details
Market size in 2022
US$ 1,361.79 Million
Market Size by 2030
US$ 2,522.51 Million
Global CAGR (2022 - 2030)
8.0%
Historical Data
2020-2021
Forecast period
2023-2030
Segments Covered
By Tipo
comerciante y de marca
By Solicitud
Comercial y Privada
Regions and Countries Covered
América del Norte
EE. UU.
Canadá
México
Market leaders and key company profiles
Shell Plc
BP Plc
Associated Energy Group LLC
TITAN Aviation Fuels Inc
CSI Enterprises Inc
TotalEnergies SE
EPIC Aviation LLC
Kropp Holdings Inc
Avfuel Corp
Multi Service Corp
Get more information on this report
North America Aviation Fuel Card Regional Insights
The regional scope of North America Aviation Fuel Card refers to the geographical area in which a business operates and competes. Understanding regional nuances, such as local consumer preferences, economic conditions, and regulatory environments, is crucial for tailoring strategies to specific markets. Businesses can expand their reach by identifying underserved regions or adapting their offerings to meet regional demands. A clear regional focus allows for more effective resource allocation, targeted marketing, and better positioning against local competitors, ultimately driving growth in those specific areas.
Get more information on this report
Identical Market Reports with other Region/Countries
The List of Companies - North America Aviation Fuel Card Market
1. Shell Plc
2. BP Plc
3. Associated Energy Group LLC
4. TITAN Aviation Fuels Inc
5. CSI Enterprises Inc
6. TotalEnergies SE
7. EPIC Aviation LLC
8. Kropp Holdings Inc
9. Avfuel Corp
10. Multi Service Corp
Frequently Asked Questions
How big is the North America Aviation Fuel Card Market?
The North America Aviation Fuel Card Market is valued at US$ 1,361.79 Million in 2022, it is projected to reach US$ 2,522.51 Million by 2030.
What is the CAGR for North America Aviation Fuel Card Market by (2022 - 2030)?
As per our report North America Aviation Fuel Card Market, the market size is valued at US$ 1,361.79 Million in 2022, projecting it to reach US$ 2,522.51 Million by 2030. This translates to a CAGR of approximately 8.0% during the forecast period.
What segments are covered in this report?
The North America Aviation Fuel Card Market report typically cover these key segments-
Tipo (comerciante y de marca)
Solicitud (Comercial y Privada)
What is the historic period, base year, and forecast period taken for North America Aviation Fuel Card Market?
The historic period, base year, and forecast period can vary slightly depending on the specific market research report. However, for the North America Aviation Fuel Card Market report:
Historic Period : 2020-2021
Base Year : 2022
Forecast Period : 2023-2030
Who are the major players in North America Aviation Fuel Card Market?
The North America Aviation Fuel Card Market is populated by several key players, each contributing to its growth and innovation. Some of the major players include:
Shell Plc
BP Plc
Associated Energy Group LLC
TITAN Aviation Fuels Inc
CSI Enterprises Inc
TotalEnergies SE
EPIC Aviation LLC
Kropp Holdings Inc
Avfuel Corp
Multi Service Corp
Who should buy this report?
The North America Aviation Fuel Card Market report is valuable for diverse stakeholders, including:
Investors: Provides insights for investment decisions pertaining to market growth, companies, or industry insights. Helps assess market attractiveness and potential returns.
Industry Players: Offers competitive intelligence, market sizing, and trend analysis to inform strategic planning, product development, and sales strategies.
Suppliers and Manufacturers: Helps understand market demand for components, materials, and services related to concerned industry.
Researchers and Consultants: Provides data and analysis for academic research, consulting projects, and market studies.
Financial Institutions: Helps assess risks and opportunities associated with financing or investing in the concerned market.
Essentially, anyone involved in or considering involvement in the North America Aviation Fuel Card Market value chain can benefit from the information contained in a comprehensive market report.
Get Free Sample For North America Aviation Fuel Card Market
1. Complete the form
2. Check your inbox (and spam/junk folder)
3. Your Personal Data is Secure with us
GDPR + CCPA Compliant
Personal & transactional information is kept safe from unauthorized use.
WHAT'S INCLUDED IN FULL REPORT : Market Dynamics,
Competitive Analysis and Assessment, Define Business Strategies, Market Outlook and
Trends, Market Size and Share Analysis, Growth Driving Factors, Future Commercial
Potential, Identify Regional Growth Engines


 Get Free Sample For North America Aviation Fuel Card Market

