Pronóstico del mercado de tabletas resistentes en Oriente Medio y África hasta 2030 – Análisis regional – por tipo (tableta totalmente resistente, tableta semirresistente y tableta ultrarresistente), sistema operativo (Android, Windows e iOS) y aplicación (aeroespacial y de defensa, automoción) , Construcción, Energía y Servicios Públicos, Manufactura, Petróleo y Gas, y otros)
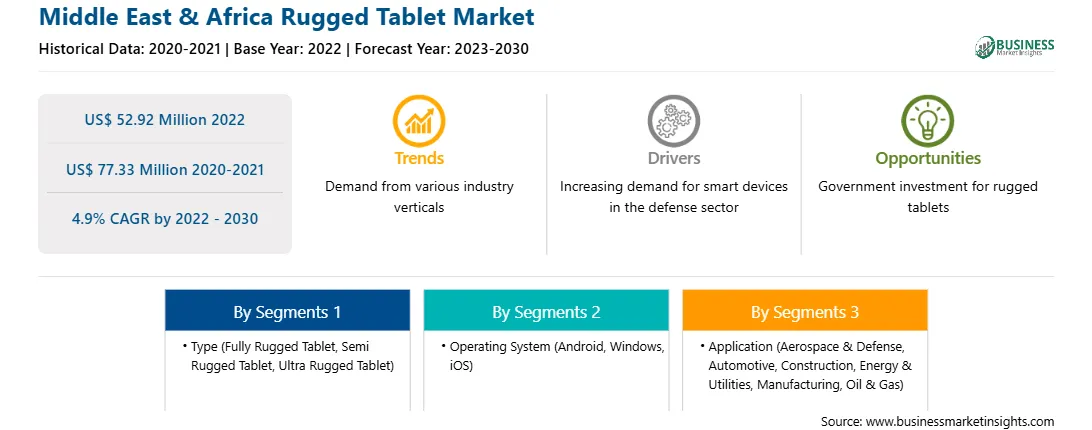
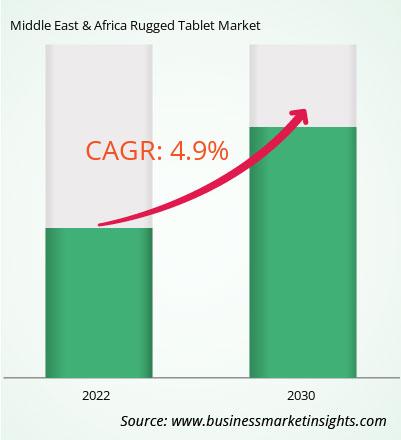
El mercado de tabletas resistentes de Oriente Medio y África se valoró en 52,92 millones de dólares en 2022 y se espera que alcance los 77,33 millones de dólares en 2030; se estima que crecerá a una tasa compuesta anual del 4,9% entre 2022 y 2030.
La creciente adopción en varias industrias refuerza el mercado de tabletas resistentes de Medio Oriente y África
La adopción de tabletas resistentes está aumentando en varias industrias, como la automotriz y la minería y otros por su durabilidad, confiabilidad y mayor rendimiento en ambientes hostiles. Las tabletas resistentes están diseñadas para soportar temperaturas extremas, polvo, agua, golpes y vibraciones, lo que las hace ideales para la construcción, los servicios públicos, la fabricación, la minería y otras industrias. En la construcción, las tabletas resistentes se pueden utilizar para diversas tareas en el sitio, como ver planos, rastrear materiales e inventario y administrar proyectos. Las tabletas resistentes se pueden utilizar en instalaciones de fabricación para monitorear líneas de producción, controlar equipos y recopilar datos.
Los dispositivos resistentes son la opción preferida de las empresas de energía y servicios públicos cuando se trata de equipar al personal de campo, según un informe de Zebra Technologies titulado \"Future of Field Operation Vision\". Aproximadamente la mitad de las empresas utilizan actualmente tabletas resistentes; durante el próximo año, esa cifra aumentará al 80%. Según la encuesta, un porcentaje aún mayor de encuestados afirmó que sus organizaciones usarían teléfonos inteligentes resistentes en los próximos cinco años, y el 93% dijo que su estrategia móvil haría uso de estos dispositivos portátiles especialmente diseñados para sus empleados de campo. Por tanto, dicha adopción puede convertirse en una tendencia futura en varias industrias.
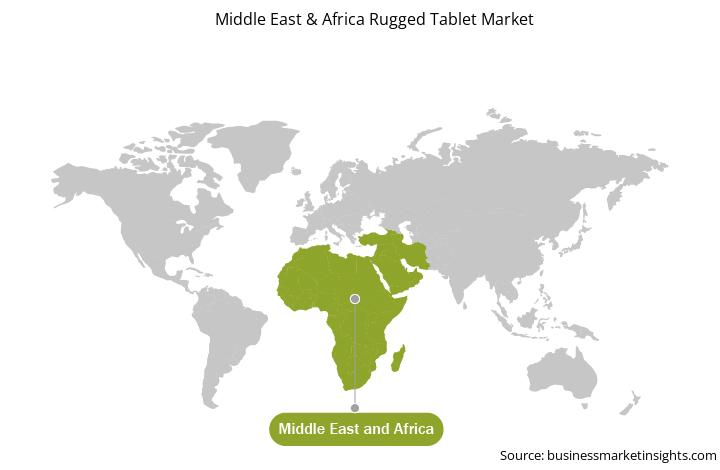
Descripción general del mercado de tabletas resistentes de Oriente Medio y África
Los Emiratos Árabes Unidos son uno de los principales países productores de petróleo del mundo y la industria ha desempeñado un papel fundamental en la configuración de su desarrollo. Los Emiratos Árabes Unidos poseen importantes reservas de petróleo, ubicadas principalmente en el emirato de Abu Dhabi. El país ha sido constantemente uno de los mayores productores de petróleo del mundo. Reservas probadas de petróleo de los EAU: aproximadamente 97,8 mil millones de barriles. Capacidad de producción de petróleo: Alrededor de 3,5 millones de barriles por día (bpd). Abu Dhabi National Oil Company (ADNOC) es la principal entidad estatal responsable de la producción, exploración y distribución de petróleo. Si bien el petróleo ha sido la piedra angular de la economía de los EAU, el gobierno lo ha estado diversificando activamente para reducir la dependencia del petróleo. Iniciativas como \"Visión 2021\" y \"Visión 2030\" tienen como objetivo desarrollar una economía basada en el conocimiento, centrándose en los sectores del turismo, las finanzas, la tecnología y las energías renovables. Los Emiratos Árabes Unidos han invertido significativamente en actividades transformadoras, como la refinación y la petroquímica. Esto incluye la construcción de complejos de refinación y el establecimiento de asociaciones estratégicas con empresas internacionales para mejorar la capacidad de refinación y la calidad del producto. Las tabletas resistentes se utilizan ampliamente en la industria del petróleo y el gas. Por lo tanto, la demanda de tabletas resistentes en los EAU está aumentando con la creciente industria del petróleo y el gas.
Ingresos del mercado de tabletas resistentes de Medio Oriente y África y pronóstico hasta 2030 (millones de dólares estadounidenses)
Segmentación del mercado de tabletas resistentes de Medio Oriente y África
El mercado de tabletas resistentes de Medio Oriente y África está segmentado según el tipo y el sistema operativo , aplicación y país. Según el tipo, el mercado de tabletas resistentes de Medio Oriente y África se clasifica en tabletas totalmente resistentes, tabletas semirresistentes y tabletas ultrarresistentes. El segmento de tabletas totalmente resistentes tuvo la mayor cuota de mercado en 2022.
En términos de sistema operativo, el mercado de tabletas resistentes de Oriente Medio y África está segmentado en Android, Windows e iOS. El segmento de Android tuvo la mayor cuota de mercado en 2022.
Por aplicación, el mercado de tabletas resistentes de Oriente Medio y África se clasifica en aeroespacial y defensa, automoción, construcción, energía y servicios públicos, fabricación, petróleo y gas, y otros. El segmento aeroespacial y de defensa tuvo la mayor participación de mercado en 2022.
Según el país, el mercado de tabletas resistentes de Medio Oriente y África está segmentado en Arabia Saudita, Sudáfrica, los Emiratos Árabes Unidos, Turquía, Nigeria, Egipto y el resto de Medio Oriente y África. Los Emiratos Árabes Unidos dominaron la cuota de mercado de tabletas resistentes de Oriente Medio y África en 2022.
AAEON Technology Inc, Dell Technologies Inc, Panasonic Holdings Corp, Getac Holdings Corp, Leonardo DRS Inc y Zebra Technologies Corp son algunos de los principales actores que operan en el mercado de tabletas resistentes de Oriente Medio y África.
Middle East & Africa Rugged Tablet Strategic Insights
Strategic insights for Middle East & Africa Rugged Tablet involve closely monitoring industry trends, consumer behaviours, and competitor actions to identify opportunities for growth. By leveraging data analytics, businesses can anticipate market shifts and make informed decisions that align with evolving customer needs. Understanding these dynamics helps companies adjust their strategies proactively, enhance customer engagement, and strengthen their competitive edge. Building strong relationships with stakeholders and staying agile in response to changes ensures long-term success in any market.
Get more information on this report
Middle East & Africa Rugged Tablet Report Scope
Report Attribute
Details
Market size in 2022
US$ 52.92 Million
Market Size by 2030
US$ 77.33 Million
Global CAGR (2022 - 2030)
4.9%
Historical Data
2020-2021
Forecast period
2023-2030
Segments Covered
By Tipo
Tablet totalmente resistente
Tablet semirresistente
Tablet ultra resistente
By Sistema operativo
Android
Windows
iOS
By Aplicación
aeroespacial y defensa
automoción
construcción
energÃa y servicios públicos
fabricación
petróleo y gas
Regions and Countries Covered
Oriente Medio y África
Sudáfrica
Arabia Saudita
Emiratos Árabes Unidos
resto de Oriente Medio y África
Market leaders and key company profiles
AAEON Technology Inc
Dell Technologies Inc
Panasonic Holdings Corp
Getac Holdings Corp
Leonardo DRS Inc
Zebra Technologies Corp
Get more information on this report
Middle East & Africa Rugged Tablet Regional Insights
The regional scope of Middle East & Africa Rugged Tablet refers to the geographical area in which a business operates and competes. Understanding regional nuances, such as local consumer preferences, economic conditions, and regulatory environments, is crucial for tailoring strategies to specific markets. Businesses can expand their reach by identifying underserved regions or adapting their offerings to meet regional demands. A clear regional focus allows for more effective resource allocation, targeted marketing, and better positioning against local competitors, ultimately driving growth in those specific areas.
Get more information on this report
Identical Market Reports with other Region/Countries
The List of Companies - Middle East & Africa Rugged Tablet Market
1. AAEON Technology Inc
2. Dell Technologies Inc
3. Panasonic Holdings Corp
4. Getac Holdings Corp
5. Leonardo DRS Inc
6. Zebra Technologies Corp
Frequently Asked Questions
How big is the Middle East & Africa Rugged Tablet Market?
The Middle East & Africa Rugged Tablet Market is valued at US$ 52.92 Million in 2022, it is projected to reach US$ 77.33 Million by 2030.
What is the CAGR for Middle East & Africa Rugged Tablet Market by (2022 - 2030)?
As per our report Middle East & Africa Rugged Tablet Market, the market size is valued at US$ 52.92 Million in 2022, projecting it to reach US$ 77.33 Million by 2030. This translates to a CAGR of approximately 4.9% during the forecast period.
What segments are covered in this report?
The Middle East & Africa Rugged Tablet Market report typically cover these key segments-
Tipo (Tablet totalmente resistente, Tablet semirresistente, Tablet ultra resistente)
Sistema operativo (Android, Windows, iOS)
Aplicación (aeroespacial y defensa, automoción, construcción, energía y servicios públicos, fabricación, petróleo y gas)
What is the historic period, base year, and forecast period taken for Middle East & Africa Rugged Tablet Market?
The historic period, base year, and forecast period can vary slightly depending on the specific market research report. However, for the Middle East & Africa Rugged Tablet Market report:
Historic Period : 2020-2021
Base Year : 2022
Forecast Period : 2023-2030
Who are the major players in Middle East & Africa Rugged Tablet Market?
The Middle East & Africa Rugged Tablet Market is populated by several key players, each contributing to its growth and innovation. Some of the major players include:
AAEON Technology Inc
Dell Technologies Inc
Panasonic Holdings Corp
Getac Holdings Corp
Leonardo DRS Inc
Zebra Technologies Corp
Who should buy this report?
The Middle East & Africa Rugged Tablet Market report is valuable for diverse stakeholders, including:
Investors: Provides insights for investment decisions pertaining to market growth, companies, or industry insights. Helps assess market attractiveness and potential returns.
Industry Players: Offers competitive intelligence, market sizing, and trend analysis to inform strategic planning, product development, and sales strategies.
Suppliers and Manufacturers: Helps understand market demand for components, materials, and services related to concerned industry.
Researchers and Consultants: Provides data and analysis for academic research, consulting projects, and market studies.
Financial Institutions: Helps assess risks and opportunities associated with financing or investing in the concerned market.
Essentially, anyone involved in or considering involvement in the Middle East & Africa Rugged Tablet Market value chain can benefit from the information contained in a comprehensive market report.
Get Free Sample For Middle East & Africa Rugged Tablet Market
1. Complete the form
2. Check your inbox (and spam/junk folder)
3. Your Personal Data is Secure with us
GDPR + CCPA Compliant
Personal & transactional information is kept safe from unauthorized use.
WHAT'S INCLUDED IN FULL REPORT : Market Dynamics,
Competitive Analysis and Assessment, Define Business Strategies, Market Outlook and
Trends, Market Size and Share Analysis, Growth Driving Factors, Future Commercial
Potential, Identify Regional Growth Engines


 Get Free Sample For Middle East & Africa Rugged Tablet Market

