Pronóstico del mercado de electrónica de potencia de Oriente Medio y África hasta 2030 – Análisis regional – por tipo (potencia discreta, módulo de potencia y circuito integrado de potencia), material [silicio (SI), carburo de silicio (SIC), nitruro de galio (GAN) y otros] y Industria Vertical (TIC, Automoción y Transporte, Electrónica de Consumo, Industrial, Energía y Potencia, y otros)
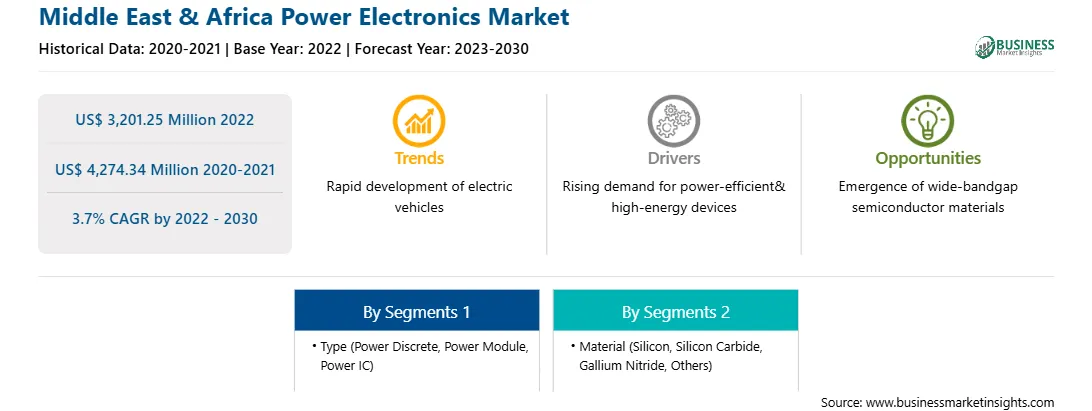
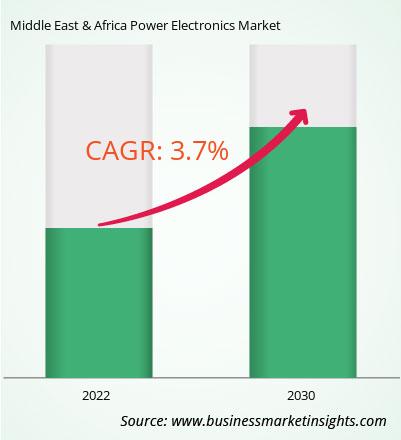
El mercado de electrónica de potencia de Oriente Medio y África estaba valorado en 3.201,25 millones de dólares en 2022 y se espera que alcance los 4.274,34 millones de dólares en 2030; se estima que registrará una CAGR del 3,7% entre 2022 y 2030.
La creciente adopción de tecnología de redes inteligentes refuerza el mercado de electrónica de potencia en Oriente Medio y África
La red inteligente puede ayudar a transformar la topología y Operación del sistema de energía de redes eléctricas. La electrónica de potencia se utiliza para controlar el flujo de energía en la red inteligente para garantizar la confiabilidad y la estabilidad de las redes inteligentes al permitir una gestión de la energía más efectiva y eficiente. Varios dispositivos electrónicos de potencia, como transistores de efecto de campo de silicio y óxido metálico (MOSFET), transistores de unión bipolar de puerta aislada (IGBT), triodo como interruptor de CA (TRIAC), tiristor de apagado de puerta (GTO) y tiristores conmutados de puerta integrada (IGCT). , entre otros, tiene un manejo de alto voltaje y una alta capacidad de carga de corriente. Estos componentes electrónicos de potencia tienen frecuencias de conmutación más altas, lo que resulta beneficioso en la conversión de la magnitud del voltaje y el control de la frecuencia al permitir el control del flujo de potencia; también aumenta su implementación en redes inteligentes. La inversión gubernamental en proyectos de microrredes, infraestructura y generación de energía está aumentando. Por ejemplo, la Agencia Internacional de Energías Renovables (IRENA) de Estados Unidos planea invertir 52 mil millones de dólares anuales en infraestructura y generación de energía para proporcionar electricidad para todos para 2030. Esta inversión equivale al 3,4% de la inversión anual promedio en el sector energético mundial. La expansión de la industria de generación de energía aumentó la demanda de electrónica de potencia para controlar el flujo de energía.
Visión general del mercado de electrónica de potencia en Oriente Medio y África
Los Emiratos Árabes Unidos son un importante productor de petróleo y gas, pero también están invirtiendo fuertemente en energía renovable. El país se ha fijado el objetivo de generar 14,2 gigavatios de electricidad a partir de fuentes renovables para 2030. Esto está impulsando la demanda de electrónica de potencia, que se utiliza para convertir y controlar la electricidad generada a partir de fuentes renovables. Además, según el Ministerio de Energía e Infraestructura, el país invertirá entre 40.800 millones de dólares (150.000 millones de AED) y 54.400 millones de dólares (200.000 millones de AED) de aquí a 2030 para garantizar que se satisfaga toda la demanda de energía y al mismo tiempo se mantenga el crecimiento económico. Por lo tanto, la creciente inversión en energías renovables en el país está impulsando el crecimiento del mercado de la electrónica de potencia.
Ingresos del mercado de electrónica de potencia de Oriente Medio y África y pronóstico hasta 2030 (millones de dólares estadounidenses)
Segmentación del mercado de electrónica de potencia de Oriente Medio y África
Electrónica de potencia de Oriente Medio y África El mercado se clasifica en tipo, material, industria vertical y país.
Según el tipo, el mercado de electrónica de potencia de Oriente Medio y África se clasifica en potencia discreta, módulo de potencia y circuito integrado de potencia. El segmento de módulos de potencia tuvo la mayor participación de mercado en 2022.
En términos de material, el mercado de electrónica de potencia de Oriente Medio y África se clasifica en silicio (SI), carburo de silicio (SIC), nitruro de galio (GAN). , y otros. El segmento de carburo de silicio (SIC) tuvo la mayor participación de mercado en 2022.
Por industria vertical, el mercado de electrónica de potencia de Oriente Medio y África está segmentado en TIC, automoción y transporte, electrónica de consumo, industrial, energía y potencia. , y otros. El segmento de electrónica de consumo tuvo la mayor cuota de mercado en 2022.
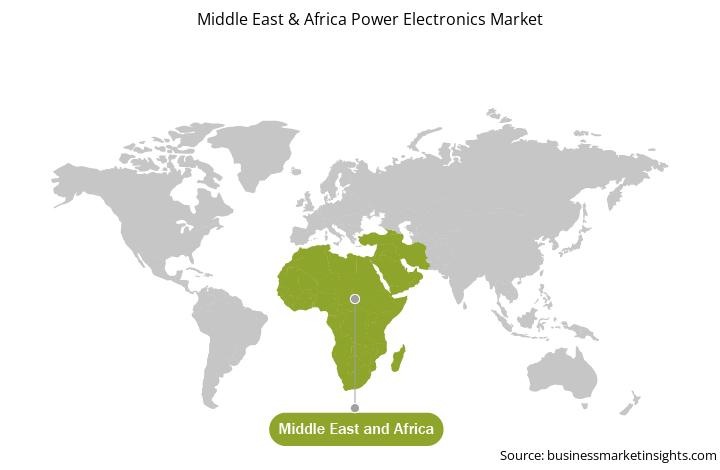
Por país, el mercado de electrónica de potencia de Oriente Medio y África está segmentado en los Emiratos Árabes Unidos, Sudáfrica, Arabia Saudita y el resto de Oriente Medio y África. Los Emiratos Árabes Unidos dominaron la cuota de mercado de electrónica de potencia de Oriente Medio y África en 2022.
Vishay Intertechnology Inc; Dispositivos electrónicos y almacenamiento de Toshiba Corp; Littelfuse, Inc; Renesas Electronics Corp; Fuji Electric Co Ltd; Mitsubishi Electric Corp; STMicroelectronics NV; e Infineon Technologies AG se encuentran entre las empresas líderes que operan en el mercado de electrónica de potencia de Oriente Medio y África.
Middle East & Africa Power Electronics Strategic Insights
Strategic insights for Middle East & Africa Power Electronics involve closely monitoring industry trends, consumer behaviours, and competitor actions to identify opportunities for growth. By leveraging data analytics, businesses can anticipate market shifts and make informed decisions that align with evolving customer needs. Understanding these dynamics helps companies adjust their strategies proactively, enhance customer engagement, and strengthen their competitive edge. Building strong relationships with stakeholders and staying agile in response to changes ensures long-term success in any market.
Get more information on this report
Middle East & Africa Power Electronics Report Scope
Report Attribute
Details
Market size in 2022
US$ 3,201.25 Million
Market Size by 2030
US$ 4,274.34 Million
Global CAGR (2022 - 2030)
3.7%
Historical Data
2020-2021
Forecast period
2023-2030
Segments Covered
By Tipo
discreto de potencia
módulo de potencia
CI de potencia
By Material
silicio
carburo de silicio
nitruro de galio
otros
Regions and Countries Covered
Oriente Medio y África
Sudáfrica
Arabia Saudita
Emiratos Árabes Unidos
resto de Oriente Medio y África
Market leaders and key company profiles
Infineon Technologies AG
STMicroelectronics NV
Mitsubishi Electric Corp
Fuji Electric Co Ltd
Renesas Electronics Corp
Littelfuse, Inc
Toshiba Electronics Devices & Storage Corp
Vishay Intertechnology Inc
Get more information on this report
Middle East & Africa Power Electronics Regional Insights
The regional scope of Middle East & Africa Power Electronics refers to the geographical area in which a business operates and competes. Understanding regional nuances, such as local consumer preferences, economic conditions, and regulatory environments, is crucial for tailoring strategies to specific markets. Businesses can expand their reach by identifying underserved regions or adapting their offerings to meet regional demands. A clear regional focus allows for more effective resource allocation, targeted marketing, and better positioning against local competitors, ultimately driving growth in those specific areas.
Get more information on this report
Identical Market Reports with other Region/Countries
The List of Companies - Middle East & Africa Power Electronics Market
1. Infineon Technologies AG 2. STMicroelectronics NV 3. Mitsubishi Electric Corp 4. Fuji Electric Co Ltd 5. Renesas Electronics Corp 6. Littelfuse, Inc 7. Toshiba Electronics Devices & Storage Corp 8. Vishay Intertechnology Inc
Frequently Asked Questions
How big is the Middle East & Africa Power Electronics Market?
The Middle East & Africa Power Electronics Market is valued at US$ 3,201.25 Million in 2022, it is projected to reach US$ 4,274.34 Million by 2030.
What is the CAGR for Middle East & Africa Power Electronics Market by (2022 - 2030)?
As per our report Middle East & Africa Power Electronics Market, the market size is valued at US$ 3,201.25 Million in 2022, projecting it to reach US$ 4,274.34 Million by 2030. This translates to a CAGR of approximately 3.7% during the forecast period.
What segments are covered in this report?
The Middle East & Africa Power Electronics Market report typically cover these key segments-
Tipo (discreto de potencia, módulo de potencia, CI de potencia)
Material (silicio, carburo de silicio, nitruro de galio, otros)
What is the historic period, base year, and forecast period taken for Middle East & Africa Power Electronics Market?
The historic period, base year, and forecast period can vary slightly depending on the specific market research report. However, for the Middle East & Africa Power Electronics Market report:
Historic Period : 2020-2021
Base Year : 2022
Forecast Period : 2023-2030
Who are the major players in Middle East & Africa Power Electronics Market?
The Middle East & Africa Power Electronics Market is populated by several key players, each contributing to its growth and innovation. Some of the major players include:
Infineon Technologies AG
STMicroelectronics NV
Mitsubishi Electric Corp
Fuji Electric Co Ltd
Renesas Electronics Corp
Littelfuse, Inc
Toshiba Electronics Devices & Storage Corp
Vishay Intertechnology Inc
Who should buy this report?
The Middle East & Africa Power Electronics Market report is valuable for diverse stakeholders, including:
Investors: Provides insights for investment decisions pertaining to market growth, companies, or industry insights. Helps assess market attractiveness and potential returns.
Industry Players: Offers competitive intelligence, market sizing, and trend analysis to inform strategic planning, product development, and sales strategies.
Suppliers and Manufacturers: Helps understand market demand for components, materials, and services related to concerned industry.
Researchers and Consultants: Provides data and analysis for academic research, consulting projects, and market studies.
Financial Institutions: Helps assess risks and opportunities associated with financing or investing in the concerned market.
Essentially, anyone involved in or considering involvement in the Middle East & Africa Power Electronics Market value chain can benefit from the information contained in a comprehensive market report.
Get Free Sample For Middle East & Africa Power Electronics Market
1. Complete the form
2. Check your inbox (and spam/junk folder)
3. Your Personal Data is Secure with us
GDPR + CCPA Compliant
Personal & transactional information is kept safe from unauthorized use.
WHAT'S INCLUDED IN FULL REPORT : Market Dynamics,
Competitive Analysis and Assessment, Define Business Strategies, Market Outlook and
Trends, Market Size and Share Analysis, Growth Driving Factors, Future Commercial
Potential, Identify Regional Growth Engines


 Get Free Sample For Middle East & Africa Power Electronics Market

