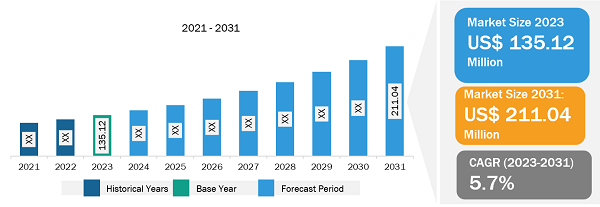
Informe de análisis de tamaño y pronóstico del mercado de imágenes térmicas y acústicas de Australia y Nueva Zelanda (2021-2031), participación de país, tendencias y oportunidades de crecimiento Cobertura: por imágenes térmicas [tipo (cámaras térmicas, visores térmicos y módulos térmicos), tecnología (enfriada y no enfriada), longitud de onda (SWIR, MWIR y LWIR) y usuario final (defensa, automotriz, atención médica y ciencias biológicas, petróleo y gas, minería, servicios públicos, alimentos y bebidas, centros de datos y otros)] e imágenes acústicas [usuario final (minería, servicios públicos, alimentos y bebidas y otros)]
El monitoreo ambiental implica el uso de herramientas y técnicas para observar y evaluar la calidad ambiental y medir el impacto de las actividades en el medio ambiente. Los datos se recopilan, analizan y compilan en informes para evaluaciones de riesgos e impacto. El objetivo es gestionar y reducir el impacto ambiental de una organización, garantizando el cumplimiento legal y protegiendo tanto el medio ambiente como la salud humana.
Las imágenes acústicas se han convertido rápidamente en una herramienta invaluable para monitorear el medio ambiente, ofreciendo una forma creativa y eficaz de estudiar los cambios naturales y provocados por el hombre a través del sonido. El uso de ondas sonoras para recopilar datos proporciona una forma no invasiva y asequible de rastrear la salud de los ecosistemas, monitorear la vida marina y observar los entornos urbanos sin alterar el entorno. Por ejemplo, en julio de 2024, una investigación dirigida por el Instituto Cawthron de Nelson arrojó nueva luz sobre la vida submarina de los delfines de Héctor, incluidos los comportamientos de alimentación y buceo de los animales, que los expertos no habían registrado anteriormente. El estudio utilizó DTAG (etiquetas de grabación acústica digital) equipadas con ventosas y adheridas temporalmente a los delfines de Héctor en Te Koko-o-Kupe/Cloudy Bay de Marlborough. Con las crecientes preocupaciones ambientales y las estrictas regulaciones de seguridad, las industrias están adoptando imágenes acústicas para monitorear las emisiones y garantizar el cumplimiento. Por ejemplo, las cámaras de imágenes acústicas pueden localizar eficazmente emisiones fugitivas y fugas de aire, lo que las convierte en herramientas valiosas para la gestión ambiental. Con la ayuda de grabaciones de sonido de un ecosistema, las empresas o autoridades de monitoreo ambiental pueden detectar especies exóticas o en peligro de extinción, describir la fenología de las especies y documentar los cambios en el estado ecológico o los impactos humanos en la naturaleza. Las cámaras de imágenes acústicas también son eficaces en el monitoreo ambiental, donde pueden localizar y brindar advertencias tempranas de niveles anormales de ruido, lo que ayuda a abordar posibles preocupaciones ambientales de manera proactiva. Australian Public Service (APS) y Net Zero National Environmental Monitoring Standards (NEMS) son algunos de los estándares y servicios gubernamentales que promueven el uso de soluciones de monitoreo ambiental. Por lo tanto, el uso de imágenes acústicas para el monitoreo ambiental está impulsando el crecimiento del mercado de imágenes térmicas y acústicas de Australia y Nueva Zelanda.
Según la longitud de onda, el mercado de imágenes térmicas y acústicas de Australia y Nueva Zelanda está segmentado en SWIR, MWIR y LWIR. El segmento MWIR tuvo la mayor participación de mercado de imágenes térmicas y acústicas de Australia y Nueva Zelanda en 2023. El infrarrojo de longitud de onda media (MWIR) generalmente se define como el rango de longitud de onda de 3,0 a 5,0 μm. Las cámaras MWIR se utilizan como sistemas de detección de fugas de gases como metano, propano, etanol y hexafluoruro de azufre. Los drones con cámaras MWIR montadas en ellos se utilizan para inspecciones de seguridad de maquinaria e infraestructura que contienen contaminantes y gases tóxicos. Estas cámaras también se utilizan cuando la precisión es más importante que la temperatura exacta, lo que permite su aplicación en la seguridad del perímetro del aeropuerto y la investigación de laboratorio para ingenieros y científicos. Las cámaras MWIR ofrecen imágenes nítidas, medición precisa de la temperatura y capacidades de análisis optimizadas necesarias para aplicaciones de investigación y desarrollo industriales, militares y de fabricación. Esto conduce a su demanda en los sectores industrial, manufacturero y de defensa.
Teledyne FLIR LLC; Testo SE & Co. KGaA; Fluke Corporation; UNI-TREND TECHNOLOGY (CHINA) CO., LTD.; Hangzhou Microimage Software Co., Ltd.; Megger Group Limited; y SDT International SA/NV se encuentran entre los actores destacados perfilados en el Informe de mercado de imágenes térmicas y acústicas de Australia y Nueva Zelanda. También se estudiaron y analizaron varios otros actores importantes en el Informe de mercado de imágenes térmicas y acústicas de Australia y Nueva Zelanda para obtener una visión holística del mercado y su ecosistema.
La cuota de mercado global de imágenes térmicas y acústicas de Australia y Nueva Zelanda se ha obtenido utilizando fuentes primarias y secundarias. Se ha llevado a cabo una investigación secundaria exhaustiva utilizando fuentes internas y externas para obtener información cualitativa y cuantitativa relacionada con el mercado de imágenes térmicas y acústicas de Australia y Nueva Zelanda. El proceso también ayuda a obtener una descripción general y un pronóstico del mercado con respecto a todos los segmentos del mercado. Además, se han realizado múltiples entrevistas primarias con participantes de la industria para validar los datos y obtener información analítica. Este proceso incluye expertos de la industria, como vicepresidentes, gerentes de desarrollo comercial, gerentes de inteligencia de mercado y gerentes de ventas nacionales, junto con consultores externos, como expertos en valoración, analistas de investigación y líderes de opinión clave, especializados en el mercado de imágenes térmicas y acústicas de Australia y Nueva Zelanda.
1. Introduction
1.1 The Insight Partners Research Report Guidance
1.2 Market Segmentation
2. Executive Summary
2.1 Key Insights
3. Research Methodology
3.1 Secondary Research
3.2 Primary Research
3.2.1 Hypothesis formulation:
3.2.2 Macro-economic factor analysis:
3.2.3 Developing base number:
3.2.4 Data Triangulation:
3.2.5 Country level data:
4. Australia and New Zealand Thermal and Acoustic Imaging Market Landscape
4.1 Overview
4.2 PEST Analysis
4.3 Ecosystem Analysis
4.3.1 List of Vendors in Value Chain
4.4 Premium Insights
4.4.1 Product Mapping
4.4.2 Company Share Analysis:
4.4.2.1 Company Share Analysis for Australia and New Zealand Thermal Imaging Market
4.4.2.2 Company Share Analysis for Australia and New Zealand Acoustic Imaging Market
5. Australia and New Zealand Thermal and Acoustic Imaging Market – Key Market Dynamics
5.1 Australia and New Zealand Thermal and Acoustic Imaging Market – Key Market Dynamics
5.2 Market Drivers
5.2.1 Rise in Military Expenditure
5.2.2 Robust Use of Thermal Imaging in Healthcare
5.2.3 Acoustic Imaging for Environmental Monitoring
5.3 Market Restraints
5.3.1 Supply Chain Disruptions
5.4 Market Opportunities
5.4.1 Integration of Artificial Intelligence in Thermal and Acoustic Imaging Systems
5.4.2 Growth of Electric Vehicle Market
5.5 Future Trends
5.5.1 Rising Demand for Miniaturization of Electronic Components
5.6 Impact of Drivers and Restraints:
6. Australia and New Zealand Thermal and Acoustic Imaging Market Analysis
6.1 Australia and New Zealand Thermal and Acoustic Imaging Market Revenue (US$ Million), 2021–2031
6.2 Australia and New Zealand Thermal and Acoustic Imaging Market Forecast and Analysis
6.3 Australia and New Zealand Thermal Imaging Market Revenue (US$ thousand), 2021–2031
6.4 Australia and New Zealand Acoustic Imaging Market Revenue (US$ thousand), 2021–2031
7. Australia and New Zealand Thermal Imaging Market Analysis – by Type
7.1 Thermal Cameras
7.1.1 Overview
7.1.2 Thermal Cameras: Australia and New Zealand Thermal Imaging Market – Revenue and Forecast to 2031 (US$ Thousand)
7.2 Thermal Scopes
7.2.1 Overview
7.2.2 Thermal Scopes: Australia and New Zealand Thermal Imaging Market – Revenue and Forecast to 2031 (US$ Thousand)
7.3 Thermal Modules
7.3.1 Overview
7.3.2 Thermal Modules: Australia and New Zealand Thermal Imaging Market – Revenue and Forecast to 2031 (US$ Thousand)
8. Australia and New Zealand Thermal Imaging Market Analysis – by Technology
8.1 Cooled
8.1.1 Overview
8.1.2 Cooled: Australia and New Zealand Thermal Imaging Market – Revenue and Forecast to 2031 (US$ Thousand)
8.2 Uncooled
8.2.1 Overview
8.2.2 Uncooled: Australia and New Zealand Thermal Imaging Market – Revenue and Forecast to 2031 (US$ Thousand)
9. Australia and New Zealand Thermal Imaging Market Analysis – by Wavelength
9.1 SWIR
9.1.1 Overview
9.1.2 SWIR: Australia and New Zealand Thermal Imaging Market – Revenue and Forecast to 2031 (US$ Thousand)
9.2 MWIR
9.2.1 Overview
9.2.2 MWIR: Australia and New Zealand Thermal Imaging Market – Revenue and Forecast to 2031 (US$ Thousand)
9.3 LWIR
9.3.1 Overview
9.3.2 LWIR: Australia and New Zealand Thermal Imaging Market – Revenue and Forecast to 2031 (US$ Thousand)
10. Australia and New Zealand Thermal Imaging Market Analysis – by End User
10.1 Aerospace and Defense
10.1.1 Overview
10.1.2 Aerospace and Defense: Australia and New Zealand Thermal Imaging Market – Revenue and Forecast to 2031 (US$ Thousand)
10.2 Automotive
10.2.1 Overview
10.2.2 Automotive: Australia and New Zealand Thermal Imaging Market – Revenue and Forecast to 2031 (US$ Thousand)
10.3 Healthcare and Life Sciences
10.3.1 Overview
10.3.2 Healthcare and Life Sciences: Australia and New Zealand Thermal Imaging Market – Revenue and Forecast to 2031 (US$ Thousand)
10.4 Oil and Gas
10.4.1 Overview
10.4.2 Oil and Gas: Australia and New Zealand Thermal Imaging Market – Revenue and Forecast to 2031 (US$ Thousand)
10.5 Mining
10.5.1 Overview
10.5.2 Mining: Australia and New Zealand Thermal Imaging Market – Revenue and Forecast to 2031 (US$ Thousand)
10.6 Utilities
10.6.1 Overview
10.6.2 Utilities: Australia and New Zealand Thermal Imaging Market – Revenue and Forecast to 2031 (US$ Thousand)
10.7 Food and Beverages
10.7.1 Overview
10.7.2 Food and Beverages: Australia and New Zealand Thermal Imaging Market – Revenue and Forecast to 2031 (US$ Thousand)
10.8 Datacentres
10.8.1 Overview
10.8.2 Datacentres: Australia and New Zealand Thermal Imaging Market – Revenue and Forecast to 2031 (US$ Thousand)
10.9 Others
10.9.1 Overview
10.9.2 Others: Australia and New Zealand Thermal Imaging Market – Revenue and Forecast to 2031 (US$ Thousand)
11. Australia and New Zealand Acoustic Imaging Market Analysis – by End User
11.1 Utilities
11.1.1 Overview
11.1.2 Utilities: Australia and New Zealand Acoustic Imaging Market – Revenue and Forecast to 2031 (US$ Thousand)
11.2 Mining
11.2.1 Overview
11.2.2 Mining: Australia and New Zealand Acoustic Imaging Market – Revenue and Forecast to 2031 (US$ Thousand)
11.3 Food and Beverages
11.3.1 Overview
11.3.2 Food and Beverages: Australia and New Zealand Acoustic Imaging Market – Revenue and Forecast to 2031 (US$ Thousand)
11.4 Others
11.4.1 Overview
11.4.2 Others: Australia and New Zealand Acoustic Imaging Market – Revenue and Forecast to 2031 (US$ Thousand)
12. Australia and New Zealand Thermal and Acoustic Imaging Market – Country Analysis
12.1 Asia Pacific
12.1.1 Australia and New Zealand Thermal and Acoustic Imaging Market Revenue and Forecast and Analysis – by Country
12.1.1.1 Australia and New Zealand Thermal and Acoustic Imaging Market Revenue and Forecast and Analysis – by Country
12.1.1.2 Australia Thermal Imaging Market – Revenue and Forecast to 2031 (US$ Thousand)
12.1.1.2.1 Australia Thermal Imaging Market Breakdown by Type
12.1.1.2.2 Australia Thermal Imaging Market Breakdown by Technology
12.1.1.2.3 Australia Thermal Imaging Market Breakdown by Wavelength
12.1.1.2.4 Australia Thermal Imaging Market Breakdown by End User
12.1.1.2.5 Australia Acoustic Imaging Market Breakdown by End User
12.1.1.3 New Zealand Thermal Imaging Market – Revenue and Forecast to 2031 (US$ Thousand)
12.1.1.3.1 New Zealand Thermal Imaging Market Breakdown by Type
12.1.1.3.2 New Zealand Thermal Imaging Market Breakdown by Technology
12.1.1.3.3 New Zealand Thermal Imaging Market Breakdown by Wavelength
12.1.1.3.4 New Zealand Thermal Imaging Market Breakdown by End User
13. Competitive Landscape
13.1 Company Positioning & Concentration
13.2 Heat Map Analysis By Key Players
14. Industry Landscape
14.1 Overview
14.2 Market Initiative
14.3 Product Development
14.4 Mergers & Acquisitions
15. Company Profiles
15.1 Teledyne FLIR LLC
15.1.1 Key Facts
15.1.2 Business Description
15.1.3 Products and Services
15.1.4 Financial Overview
15.1.5 SWOT Analysis
15.1.6 Key Developments
15.2 Testo SE & Co. KGaA
15.2.1 Key Facts
15.2.2 Business Description
15.2.3 Products and Services
15.2.4 Financial Overview
15.2.5 SWOT Analysis
15.2.6 Key Developments
15.3 Fluke Corporation
15.3.1 Key Facts
15.3.2 Business Description
15.3.3 Products and Services
15.3.4 Financial Overview
15.3.5 SWOT Analysis
15.3.6 Key Developments
15.4 UNI-TREND TECHNOLOGY (CHINA) CO., LTD.
15.4.1 Key Facts
15.4.2 Business Description
15.4.3 Products and Services
15.4.4 Financial Overview
15.4.5 SWOT Analysis
15.4.6 Key Developments
15.5 Hangzhou Microimage Software Co., Ltd.
15.5.1 Key Facts
15.5.2 Business Description
15.5.3 Products and Services
15.5.4 Financial Overview
15.5.5 SWOT Analysis
15.5.6 Key Developments
15.6 Megger Group Limited
15.6.1 Key Facts
15.6.2 Business Description
15.6.3 Products and Services
15.6.4 Financial Overview
15.6.5 SWOT Analysis
15.6.6 Key Developments
15.7 SDT International SA/NV
15.7.1 Key Facts
15.7.2 Business Description
15.7.3 Products and Services
15.7.4 Financial Overview
15.7.5 SWOT Analysis
15.7.6 Key Developments
16. Appendix
16.1 About The Insight Partners
16.2 Word Index
List of Tables
Table 1. Australia and New Zealand Thermal and Acoustic Imaging Market Segmentation
Table 2. Ecosystem: Australia and New Zealand Thermal and Acoustic Imaging Market
Table 3. List of Vendors in Value Chain
Table 4. Australia and New Zealand Thermal and Acoustic Imaging Market – Revenue and Forecast to 2031 (US$ Thousand)
Table 5. Australia and New Zealand Thermal Imaging Market – Revenue and Forecast to 2031 (US$ Thousand) – by Type
Table 6. Australia and New Zealand Thermal Imaging Market – Revenue and Forecast to 2031 (US$ Thousand) – by Technology
Table 7. Australia and New Zealand Thermal Imaging Market – Revenue and Forecast to 2031 (US$ Thousand) – by Wavelength
Table 8. Australia and New Zealand Thermal Imaging Market – Revenue and Forecast to 2031 (US$ Thousand) – by End User
Table 9. Australia and New Zealand Acoustic Imaging Market – Revenue and Forecast to 2031 (US$ Thousand) – by End User
Table 10. Australia and New Zealand Thermal and Acoustic Imaging Market – Revenue and Forecast to 2031 (US$ Thousand) – by Country
Table 11. Australia Thermal Imaging Market – Revenue and Forecast to 2031 (US$ Thousand) – by Type
Table 12. Australia Thermal Imaging Market – Revenue and Forecast to 2031 (US$ Thousand) – by Technology
Table 13. Australia Thermal Imaging Market – Revenue and Forecast to 2031 (US$ Thousand) – by Wavelength
Table 14. Australia Thermal Imaging Market – Revenue and Forecast to 2031 (US$ Thousand) – by End User
Table 15. Australia Acoustic Imaging Market – Revenue and Forecast to 2031 (US$ Thousand) – by End User
Table 16. New Zealand Thermal Imaging Market – Revenue and Forecast to 2031 (US$ Thousand) – by Type
Table 17. New Zealand Thermal Imaging Market – Revenue and Forecast to 2031 (US$ Thousand) – by Technology
Table 18. New Zealand Thermal Imaging Market – Revenue and Forecast to 2031 (US$ Thousand) – by Wavelength
Table 19. New Zealand Thermal Imaging Market – Revenue and Forecast to 2031 (US$ Thousand) – by End User
Table 20. New Zealand Acoustic Imaging Market – Revenue and Forecast to 2031 (US$ Thousand) – by End User
Table 21. Company Positioning & Concentration
Table 22. List of Abbreviation
List of Figures
Figure 1. Australia and New Zealand Thermal and Acoustic Imaging Market Segmentation, by Country
Figure 2. PEST Analysis
Figure 3. Impact Analysis of Drivers and Restraints
Figure 4. Australia and New Zealand Thermal and Acoustic Imaging Market Revenue (US$ Thousand), 2021–2031
Figure 5. Australia and New Zealand Thermal Imaging Market Revenue (US$ Thousand), 2021–2031
Figure 6. Australia and New Zealand Acoustic Imaging Market Revenue (US$ Thousand), 2021–2031
Figure 7. Australia and New Zealand Thermal Imaging Market Share (%) – by Type, 2023 and 2031
Figure 8. Thermal Cameras: Australia and New Zealand Thermal and Acoustic Imaging Market – Revenue and Forecast to 2031 (US$ Thousand)
Figure 9. Thermal Scopes: Australia and New Zealand Thermal Imaging Market – Revenue and Forecast to 2031 (US$ Thousand)
Figure 10. Thermal Modules: Australia and New Zealand Thermal Imaging Market – Revenue and Forecast to 2031 (US$ Thousand)
Figure 11. Australia and New Zealand Thermal Imaging Market Share (%) – by Technology, 2023 and 2031
Figure 12. Cooled: Australia and New Zealand Thermal Imaging Market – Revenue and Forecast to 2031 (US$ Thousand)
Figure 13. Uncooled: Australia and New Zealand Thermal Imaging Market – Revenue and Forecast to 2031 (US$ Thousand)
Figure 14. Australia and New Zealand Thermal Imaging Market Share (%) – by Wavelength, 2023 and 2031
Figure 15. SWIR: Australia and New Zealand Thermal Imaging Market – Revenue and Forecast to 2031 (US$ Thousand)
Figure 16. MWIR: Australia and New Zealand Thermal Imaging Market – Revenue and Forecast to 2031 (US$ Thousand)
Figure 17. LWIR: Australia and New Zealand Thermal Imaging Market – Revenue and Forecast to 2031 (US$ Thousand)
Figure 18. Australia and New Zealand Thermal Imaging Market Share (%) – by End User, 2023 and 2031
Figure 19. Aerospace and Defense: Australia and New Zealand Thermal Imaging Market – Revenue and Forecast to 2031 (US$ Thousand)
Figure 20. Automotive: Australia and New Zealand Thermal Imaging Market – Revenue and Forecast to 2031 (US$ Thousand)
Figure 21. Healthcare and Life Sciences: Australia and New Zealand Thermal Imaging Market – Revenue and Forecast to 2031 (US$ Thousand)
Figure 22. Oil and Gas: Australia and New Zealand Thermal Imaging Market – Revenue and Forecast to 2031 (US$ Thousand)
Figure 23. Mining: Australia and New Zealand Thermal Imaging Market – Revenue and Forecast to 2031 (US$ Thousand)
Figure 24. Utilities: Australia and New Zealand Thermal Imaging Market – Revenue and Forecast to 2031 (US$ Thousand)
Figure 25. Food and Beverages: Australia and New Zealand Thermal Imaging Market – Revenue and Forecast to 2031 (US$ Thousand)
Figure 26. Datacentres: Australia and New Zealand Thermal Imaging Market – Revenue and Forecast to 2031 (US$ Thousand)
Figure 27. Others: Australia and New Zealand Thermal Imaging Market – Revenue and Forecast to 2031 (US$ Thousand)
Figure 28. Australia and New Zealand Acoustic Imaging Market Share (%) – by End User, 2023 and 2031
Figure 29. Utilities: Australia and New Zealand Acoustic Imaging Market – Revenue and Forecast to 2031 (US$ Thousand)
Figure 30. Mining: Australia and New Zealand Acoustic Imaging Market – Revenue and Forecast to 2031 (US$ Thousand)
Figure 31. Food and Beverages: Australia and New Zealand Acoustic Imaging Market – Revenue and Forecast to 2031 (US$ Thousand)
Figure 32. Others: Australia and New Zealand Thermal and Acoustic Imaging Market – Revenue and Forecast to 2031 (US$ Thousand)
Figure 33. Australia and New Zealand Thermal and Acoustic Imaging Market Breakdown by Key Countries, 2023 and 2031 (%)
Figure 34. Australia Thermal Imaging Market – Revenue and Forecast to 2031 (US$ Thousand)
Figure 35. Australia Acoustic Imaging Market – Revenue and Forecast to 2031 (US$ Thousand)
Figure 36. New Zealand Thermal Imaging Market – Revenue and Forecast to 2031 (US$ Thousand)
Figure 37. New Zealand Acoustic Imaging Market – Revenue and Forecast to 2031 (US$ Thousand)
Figure 38. Heat Map Analysis By Key Players
- Teledyne FLIR LLC
- Testo SE & Co. KGaA
- Fluke Corporation
- UNI-TREND TECHNOLOGY (CHINA) CO., LTD.
- Hangzhou Microimage Software Co., Ltd.
- Megger Group Limited
- SDT International SA/NV.
- Save and reduce time carrying out entry-level research by identifying the growth, size, leading players, and segments in the Australia and New Zealand thermal and acoustic imaging market
- Highlights key business priorities in order to assist companies to realign their business strategies
- The key findings and recommendations such as specific country and segmental insight highlights crucial progressive industry trends in the Australia and New Zealand thermal and acoustic imaging market, thereby allowing players across the value chain to develop effective long-term strategies
- Develop/modify business expansion plans by using substantial growth offering developed and emerging markets
- Scrutinize in-depth market trends and outlook coupled with the factors driving the market, as well as those hindering it
- Enhance the decision-making process by understanding the strategies that underpin commercial interest with respect to client products, segmentation, pricing, and distribution