Analysis - by Form (Powder and Liquid), Category (Organic and Conventional), and Application (Food & Beverages [Bakery & Confectionery, Dairy & Frozen Desserts, Beverages, Sweet & Savory Snacks, and Others], Personal Care, and Others)
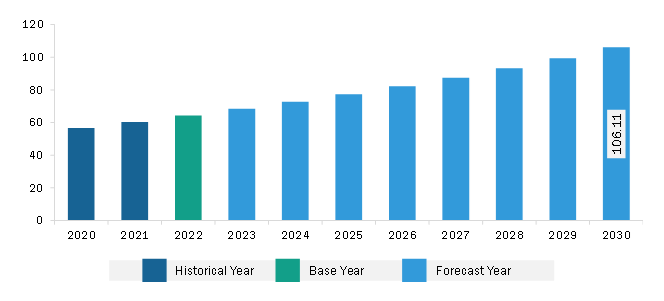
The Asia Pacific vanilla extract market was valued at US$ 64.36 million in 2022 and is expected to reach US$ 106.11 million by 2030; it is estimated to record a CAGR of 6.4% from 2022 to 2030.
Expanding Demand for Natural/Clean-Label Ingredients Fuels Asia Pacific Vanilla Extract Market
Consumers across the world are leaning toward the adoption of a healthier lifestyle. Natural flavors can satisfy consumers' dietary requirements. Descriptions on menus and labels on food packaging highly influence consumer preferences. Clean-label products are becoming increasingly popular as consumers prefer 100% natural products with no synthetic ingredients such as preservatives, artificial colors, flavors, and others.
Consumer demand and international regulations have prompted various application industries to seek active ingredients from natural sources to produce safe and sustainable products. Thus, manufacturers of vanilla extracts expand their product portfolio to fulfil the increasing demand for natural and clean-label ingredients.
Thus, the rising demand for natural and clean-label ingredients is expected to provide lucrative opportunities for the Asia Pacific vanilla extract market during the forecast period.
Asia Pacific Vanilla Extract Market Overview
The Rest of Asia Pacific vanilla extract market is segmented into Singapore, Indonesia, Thailand, Malaysia, and New Zealand, among others. These countries are expected to witness significant growth in the vanilla extract market owing to consumers' growing popularity of natural & organic food products. Singapore, Indonesia, Thailand, and Malaysia are among the few countries famous for aromatic therapies. Many spas, beauty clinics, massage centers, and aromatherapy centers in these countries use essential oils containing vanilla extract that have healing, moisturizing, and soothing properties. Further, the increasing adoption of natural detoxifying cleaners and sanitizers is anticipated to accelerate the demand for vanilla extract.
Asia Pacific Vanilla Extract Market Revenue and Forecast to 2030 (US$ Million)
Asia Pacific Vanilla Extract Market Segmentation
The Asia Pacific vanilla extract market is segmented based on form, category, application, and country. Based on form, the Asia Pacific vanilla extract market is bifurcated into powder and liquid. The liquid segment held a larger market share in 2022.
In terms of category, the Asia Pacific vanilla extract market is bifurcated into organic and conventional. The conventional segment held a larger market share in 2022.
By application, the Asia Pacific vanilla extract market is categorized into food & beverages, personal care, and others. The food & beverages segment held the largest market share in 2022. Further, food & beverages segment is categorized into bakery & confectionery, dairy & frozen desserts, beverages, sweet & savory snacks, and others.
Based on country, the Asia Pacific vanilla extract market is segmented into China, Japan, India, Australia, South Korea, Southeast Asia, and the Rest of Asia Pacific. The Rest of Asia Pacific dominated the Asia Pacific vanilla extract market share in 2022.
Prova SAS, Tharakan and Co, Natural Vanilla Pty Ltd, Kerry Group Plc, Archer-Daniels-Midland Co, and Synergy Flavors Inc are some of the leading players operating in the Asia Pacific vanilla extract market.
Asia Pacific Vanilla Extract Market Strategic Insights
Get more information on this report
Asia Pacific Vanilla Extract Market Segmentation Analysis
Asia Pacific Vanilla Extract Market Report Highlights
Asia Pacific Vanilla Extract Report Scope
Report Attribute
Details
Market size in 2022
US$ 64.36 Million
Market Size by 2030
US$ 106.11 Million
CAGR (2022 - 2030)
6.4%
Historical Data
2020-2021
Forecast period
2023-2030
Segments Covered
By Form
Powder
Liquid
By Category
Organic
Conventional
By Application
Food & Beverages
Personal Care
Regions and Countries Covered
Asia-Pacific
China, India, Japan, Australia, Rest of Asia-Pacific
Market leaders and key company profiles
Prova SAS
Tharakan and Co
Natural Vanilla Pty Ltd
Kerry Group Plc
Archer-Daniels-Midland Co
Synergy Flavors Inc
Get more information on this report
Asia Pacific Vanilla Extract Market Country and Regional Insights
Get more information on this report
Identical Market Reports with other Region/Countries
The List of Companies - Asia Pacific Vanilla Extract Market
1. Prova SAS2. Tharakan and Co3. Natural Vanilla Pty Ltd4. Kerry Group Plc5. Archer-Daniels-Midland Co6. Synergy Flavors Inc
Frequently Asked Questions
How big is the Asia Pacific Vanilla Extract Market?
The Asia Pacific Vanilla Extract Market is valued at US$ 64.36 Million in 2022, it is projected to reach US$ 106.11 Million by 2030.
What is the CAGR for Asia Pacific Vanilla Extract Market by (2022 - 2030)?
As per our report Asia Pacific Vanilla Extract Market, the market size is valued at US$ 64.36 Million in 2022, projecting it to reach US$ 106.11 Million by 2030. This translates to a CAGR of approximately 6.4% during the forecast period.
What segments are covered in this report?
The Asia Pacific Vanilla Extract Market report typically cover these key segments-
Form (Powder, Liquid)
Category (Organic, Conventional)
Application (Food & Beverages, Personal Care)
What is the historic period, base year, and forecast period taken for Asia Pacific Vanilla Extract Market?
The historic period, base year, and forecast period can vary slightly depending on the specific market research report. However, for the Asia Pacific Vanilla Extract Market report:
Historic Period : 2020-2021
Base Year : 2022
Forecast Period : 2023-2030
Who are the major players in Asia Pacific Vanilla Extract Market?
The Asia Pacific Vanilla Extract Market is populated by several key players, each contributing to its growth and innovation. Some of the major players include:
Prova SAS
Tharakan and Co
Natural Vanilla Pty Ltd
Kerry Group Plc
Archer-Daniels-Midland Co
Synergy Flavors Inc
Who should buy this report?
The Asia Pacific Vanilla Extract Market report is valuable for diverse stakeholders, including:
Investors: Provides insights for investment decisions pertaining to market growth, companies, or industry insights. Helps assess market attractiveness and potential returns.
Industry Players: Offers competitive intelligence, market sizing, and trend analysis to inform strategic planning, product development, and sales strategies.
Suppliers and Manufacturers: Helps understand market demand for components, materials, and services related to concerned industry.
Researchers and Consultants: Provides data and analysis for academic research, consulting projects, and market studies.
Financial Institutions: Helps assess risks and opportunities associated with financing or investing in the concerned market.
Essentially, anyone involved in or considering involvement in the Asia Pacific Vanilla Extract Market value chain can benefit from the information contained in a comprehensive market report.


 Get Free Sample For Asia Pacific Vanilla Extract Market


