Pronóstico del mercado de emisión de boletos inteligentes en Asia Pacífico hasta 2031: análisis regional por componente (hardware, software y servicios), sistema de pago (sistema de pago abierto, tarjeta inteligente y NFC) y usuario final (transporte, deporte y entretenimiento, estacionamiento y otros)
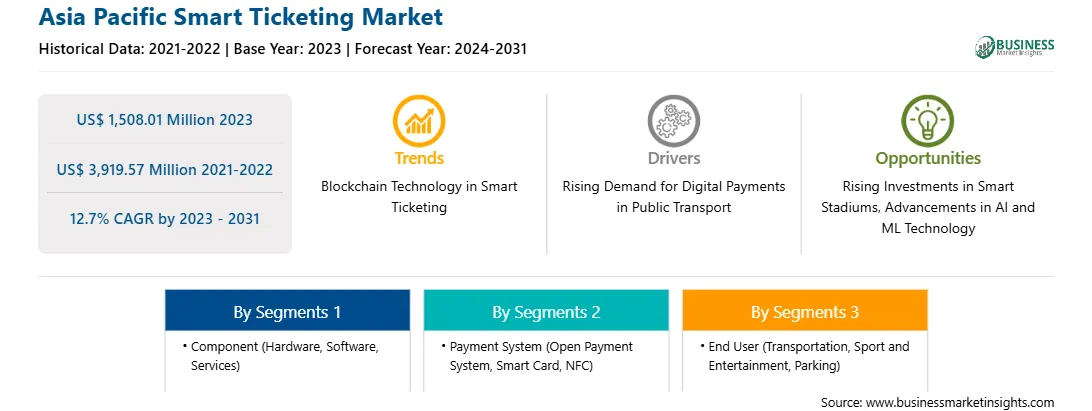
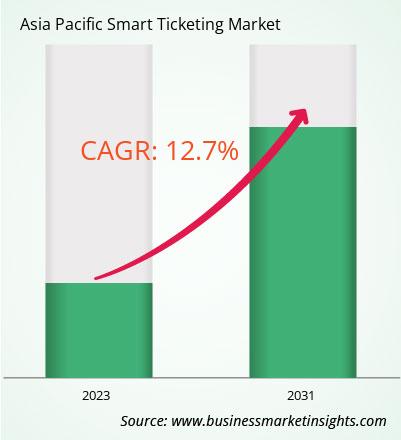
El mercado de venta de entradas inteligentes de Asia Pacífico se valoró en 1.508,01 millones de dólares en 2023 y se espera que alcance los 3.919,57 millones de dólares en 2031; se estima que registrará una CAGR del 12,7% entre 2023 y 2031.
Las crecientes inversiones en estadios inteligentes impulsan el mercado de venta de entradas inteligentes de Asia Pacífico
En los últimos años, la necesidad mundial de sistemas de experiencia sin contacto ha acelerado el uso de la venta de entradas inteligentes en los procesos de venta de estadios y eventos. La venta de entradas inteligentes proporciona una forma sencilla para que los organizadores de estadios y eventos realicen sus operaciones de forma más eficiente, evitando costes generales y cuellos de botella de procedimiento. Esto es crucial ya que la venta de entradas tradicional en papel necesita más mano de obra y recursos, lo que la convierte en un método insostenible para organizar eventos deportivos. La implementación de un sistema de venta de entradas inteligente puede mejorar drásticamente las ventas de entradas al permitir a los aficionados comprobar la disponibilidad de sus asientos favoritos y pedir entradas que coincidan con sus preferencias. Los datos significativos adquiridos a partir de estas reservas permiten a los organizadores determinar en qué áreas están más interesados los aficionados, lo que da como resultado el desarrollo de estrategias de venta de entradas específicas que atraen a segmentos de audiencia específicos. Con la venta de entradas inteligente encargándose de la validación de las entradas, el personal del estadio puede ser reasignado para mejorar las experiencias de los aficionados, ayudar con la gestión de la multitud, proporcionar información y orientación, o apoyar áreas clave que requieren intervención humana. La venta de entradas inteligente hace el mejor uso de los trabajadores al agilizar las operaciones de venta de entradas, impulsando tanto la eficiencia operativa como la experiencia completa del estadio para los asistentes. Por ejemplo, millones de seguidores utilizaron entradas RFID durante la Copa FIFA Confederaciones en 2013, la Copa Mundial de la FIFA en 2014, la Copa FIFA Confederaciones en 2017, la Copa Mundial de la FIFA en 2018, la Copa Árabe de la FIFA en 2021 y la Copa Mundial de la FIFA 2022 en Qatar. La FIFA había designado a HID como su productor oficial de entradas. Por lo tanto, se espera que el aumento de las inversiones en estadios inteligentes para que la experiencia de pago del usuario sea fluida cree oportunidades lucrativas para la expansión del mercado de venta de entradas inteligente.
Resumen del mercado de venta de billetes inteligentes en Asia Pacífico
El mercado de venta de billetes inteligentes en Asia Pacífico está experimentando un crecimiento significativo, que se atribuye a la creciente adopción de tecnologías avanzadas para brindar comodidad en varios sectores en países densamente poblados. Se espera que el mercado se beneficie de la creciente digitalización regional. Por ejemplo, en abril de 2023, el lanzamiento por parte de China de una aplicación móvil unificada que integra varias plataformas de venta de billetes de más de 140 países es un avance notable en este espacio. Esta iniciativa refleja el enfoque cada vez mayor de la región en las soluciones de venta de billetes inteligentes para mejorar la eficiencia de los sistemas de tránsito y satisfacer las necesidades de una gran población. Según la Compañía de la Academia de Ciencias Ferroviarias de China, el sistema, creado específicamente para las naciones que participan en la Iniciativa del Cinturón y la Ruta de China, vincularía y coordinaría sus plataformas para la venta de billetes.
Además, el crecimiento del mercado de venta de billetes inteligentes se atribuye en gran medida a la creciente preferencia por los pagos sin contacto. Este cambio en el comportamiento del consumidor se ha convertido en un factor impulsor significativo para la industria de la venta de billetes inteligentes, ya que las empresas de varios sectores buscan capitalizar la comodidad y la seguridad que ofrecen las soluciones de pago sin contacto.
Ingresos y pronóstico del mercado de boletos inteligentes de Asia Pacífico hasta 2031 (millones de USD)
Segmentación del mercado de boletos inteligentes de Asia Pacífico
El mercado de boletos inteligentes de Asia Pacífico se clasifica en componente, sistema de pago, usuario final y país.
Según el componente, el mercado de boletos inteligentes de Asia Pacífico se segmenta en hardware, software y servicios. El segmento de hardware tuvo la mayor participación de mercado en 2023.
Por tecnología, el mercado de boletos inteligentes de Asia Pacífico está segmentado en sistema de pago abierto, tarjeta inteligente y NFC. El segmento de tarjeta inteligente tuvo la mayor participación de mercado en 2023.
Según el usuario final, el mercado de boletos inteligentes de Asia Pacífico está segmentado en transporte, deporte y entretenimiento, estacionamiento y otros. El segmento de transporte tuvo la mayor participación de mercado en 2023.
Por país, el mercado de boletos inteligentes de Asia Pacífico está segmentado en India, China, Japón, Corea del Sur, Australia y el resto de Asia Pacífico. China dominó la participación de mercado de boletos inteligentes en Asia Pacífico en 2023.
Infineon Technologies AG, NXP Semiconductors NV, Xerox Holdings Corp, Cubic Corp, IDEMIA France SAS, Thales SA, Confidex, HID Global Corp y Siemens Energy AG son algunas de las empresas líderes que operan en el mercado de boletos inteligentes de Asia Pacífico.
Asia Pacific Smart Ticketing Strategic Insights
Strategic insights for Asia Pacific Smart Ticketing involve closely monitoring industry trends, consumer behaviours, and competitor actions to identify opportunities for growth. By leveraging data analytics, businesses can anticipate market shifts and make informed decisions that align with evolving customer needs. Understanding these dynamics helps companies adjust their strategies proactively, enhance customer engagement, and strengthen their competitive edge. Building strong relationships with stakeholders and staying agile in response to changes ensures long-term success in any market.
Get more information on this report
Asia Pacific Smart Ticketing Report Scope
Report Attribute
Details
Market size in 2023
US$ 1,508.01 Million
Market Size by 2031
US$ 3,919.57 Million
Global CAGR (2023 - 2031)
12.7%
Historical Data
2021-2022
Forecast period
2024-2031
Segments Covered
By Componente
hardware
software
servicios
By Sistema de pago
Sistema de pago abierto
Tarjeta inteligente
NFC
By Usuario final
Transporte
Deporte y Entretenimiento
Estacionamiento
Regions and Countries Covered
Asia-Pacífico
China
India
Japón
Australia
resto de Asia-Pacífico
Market leaders and key company profiles
Infineon Technologies AG.
NXP Semiconductors NV.
Xerox Holdings Corp.
Cubic Corp.
IDEMIA France SAS.
Thales SA.
Confidex.
HID Global Corp.
Siemens Energy AG.
Get more information on this report
Asia Pacific Smart Ticketing Regional Insights
The regional scope of Asia Pacific Smart Ticketing refers to the geographical area in which a business operates and competes. Understanding regional nuances, such as local consumer preferences, economic conditions, and regulatory environments, is crucial for tailoring strategies to specific markets. Businesses can expand their reach by identifying underserved regions or adapting their offerings to meet regional demands. A clear regional focus allows for more effective resource allocation, targeted marketing, and better positioning against local competitors, ultimately driving growth in those specific areas.
Get more information on this report
Identical Market Reports with other Region/Countries
The List of Companies - Asia Pacific Smart Ticketing Market
Infineon Technologies AG.
NXP Semiconductors NV.
Xerox Holdings Corp.
Cubic Corp.
IDEMIA France SAS.
Thales SA.
Confidex.
HID Global Corp.
Siemens Energy AG.
Frequently Asked Questions
How big is the Asia Pacific Smart Ticketing Market?
The Asia Pacific Smart Ticketing Market is valued at US$ 1,508.01 Million in 2023, it is projected to reach US$ 3,919.57 Million by 2031.
What is the CAGR for Asia Pacific Smart Ticketing Market by (2023 - 2031)?
As per our report Asia Pacific Smart Ticketing Market, the market size is valued at US$ 1,508.01 Million in 2023, projecting it to reach US$ 3,919.57 Million by 2031. This translates to a CAGR of approximately 12.7% during the forecast period.
What segments are covered in this report?
The Asia Pacific Smart Ticketing Market report typically cover these key segments-
Componente (hardware, software, servicios)
Sistema de pago (Sistema de pago abierto, Tarjeta inteligente, NFC)
Usuario final (Transporte, Deporte y Entretenimiento, Estacionamiento)
What is the historic period, base year, and forecast period taken for Asia Pacific Smart Ticketing Market?
The historic period, base year, and forecast period can vary slightly depending on the specific market research report. However, for the Asia Pacific Smart Ticketing Market report:
Historic Period : 2021-2022
Base Year : 2023
Forecast Period : 2024-2031
Who are the major players in Asia Pacific Smart Ticketing Market?
The Asia Pacific Smart Ticketing Market is populated by several key players, each contributing to its growth and innovation. Some of the major players include:
Infineon Technologies AG.
NXP Semiconductors NV.
Xerox Holdings Corp.
Cubic Corp.
IDEMIA France SAS.
Thales SA.
Confidex.
HID Global Corp.
Siemens Energy AG.
Who should buy this report?
The Asia Pacific Smart Ticketing Market report is valuable for diverse stakeholders, including:
Investors: Provides insights for investment decisions pertaining to market growth, companies, or industry insights. Helps assess market attractiveness and potential returns.
Industry Players: Offers competitive intelligence, market sizing, and trend analysis to inform strategic planning, product development, and sales strategies.
Suppliers and Manufacturers: Helps understand market demand for components, materials, and services related to concerned industry.
Researchers and Consultants: Provides data and analysis for academic research, consulting projects, and market studies.
Financial Institutions: Helps assess risks and opportunities associated with financing or investing in the concerned market.
Essentially, anyone involved in or considering involvement in the Asia Pacific Smart Ticketing Market value chain can benefit from the information contained in a comprehensive market report.
Get Free Sample For Asia Pacific Smart Ticketing Market
1. Complete the form
2. Check your inbox (and spam/junk folder)
3. Your Personal Data is Secure with us
GDPR + CCPA Compliant
Personal & transactional information is kept safe from unauthorized use.
WHAT'S INCLUDED IN FULL REPORT : Market Dynamics,
Competitive Analysis and Assessment, Define Business Strategies, Market Outlook and
Trends, Market Size and Share Analysis, Growth Driving Factors, Future Commercial
Potential, Identify Regional Growth Engines


 Get Free Sample For Asia Pacific Smart Ticketing Market

