Analysis - by Type (Fully Rugged Tablet, Semi Rugged Tablet, and Ultra Rugged Tablet), Operating System (Android, Windows, and iOS), and Application (Aerospace & Defense, Automotive, Construction, Energy & Utilities, Manufacturing, Oil & Gas, and Others)
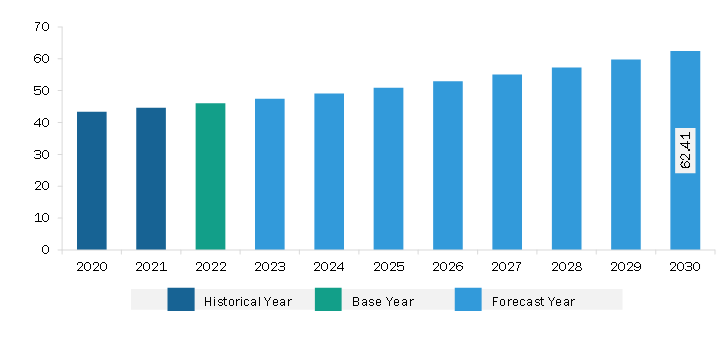
The South & Central America rugged tablet market was valued at US$ 46.00 million in 2022 and is expected to reach US$ 62.41 million by 2030; it is estimated to grow at a CAGR of 3.9% from 2022 to 2030.
Rise of New Technologies, Such as AI and IoT Fuels South & Central America Rugged Tablet Market
AI-enabled devices are all over the place. According to Simpli Learn, AI technology is used in some form or another in over 77% of today's electronics. Moreover, Rugged tablet computers can gather and send data from numerous sensors and devices in the field regarding IoT. These tablets may be fitted with specific data collection and analysis software, making it more straightforward to monitor and manage IoT devices remotely. For instance, a rugged tablet can be used to track the whereabouts of a fleet of cars, operate industrial machinery, and check the temperature and humidity levels in a warehouse.
Rugged tablets can also be integrated with AI devices for safety. Various authorities are using collaborated rugged tablets for school safety, government buildings, and other public spaces. For instance, in October 2023, KYOCERA collaborated with three technology developers on an innovative solution to improve safety in schools, government buildings, and other public spaces. Kyocera's ultra-rugged mobile technology (Android smartphones and tablets); Omni-Response 360° sensory technology for optimal situational awareness with a comprehensive dashboard; ZeroEyes AI gun detection and intelligent situational awareness software; and Cradlepoint networks that connect sites, vehicles, IoT technology, and safety personnel comprise the school safety solution. Thus, the rise of new technologies, such as AI and IoT, is expected to offer lucrative opportunities for market growth.
South & Central America Rugged Tablet Market Overview
The rugged tablet market in the Rest of SAM is subsegmented into Chile, Peru, and others. The market is propelled by rising demand from the transportation and energy industries. The transport infrastructure sector in Peru reported progress in 2022, with investments of US$ 467 million in airport, railway, port, and highway projects in January-November 2022. Also, airports received investments of US$ 33.7 million from January to November 2022, with some months seeing investments below US$ 1 million.
According to a report by global renewable energy firm Mainstream Renewable Power, Chile has the potential to produce 44GW of wind power. Chile's heavy reliance on energy imports has fueled the demand for renewable energy. Also, huge increases in energy prices due to the country's summer months giving rise to long dry spells have driven the need for renewable power sources produced domestically. Rugged tablets are used more than traditional ones in the transportation and energy industries to save and transfer data, boosting the rugged tablet market growth in the Rest of South & Central America.
South & Central America Rugged Tablet Market Revenue and Forecast to 2030 (US$ Million)
South & Central America Rugged Tablet Market Segmentation
The South & Central America rugged tablet market is segmented based on type, operating system, application, and country. Based on type, the South & Central America rugged tablet market is segmented into fully rugged tablet, semi rugged tablet, and ultra rugged tablet. The fully rugged tablet segment held the largest market share in 2022.
In terms of operating system, the South & Central America rugged tablet market is categorized into android, windows, and iOS. The android segment held the largest market share in 2022.
By application, the South & Central America rugged tablet market is segmented into aerospace & defense, automotive, construction, energy & utilities, manufacturing, oil & gas, and others. The aerospace & defense segment held the largest market share in 2022.
Based on country, the South & Central America rugged tablet market is segmented into Brazil, Argentina, Columbia, and the Rest of South & Central America. The Rest of South & Central America dominated the South & Central America rugged tablet market share in 2022.
AAEON Technology Inc, Dell Technologies Inc, Panasonic Holdings Corp, Zebra Technologies Corp, and Kontron AG are some of the leading players operating in the South & Central America rugged tablet market.
South & Central America Rugged Tablet Market Strategic Insights
Get more information on this report
South & Central America Rugged Tablet Market Segmentation Analysis
South & Central America Rugged Tablet Market Report Highlights
South & Central America Rugged Tablet Report Scope
Report Attribute
Details
Market size in 2022
US$ 46.00 Million
Market Size by 2030
US$ 62.41 Million
CAGR (2022 - 2030)
3.9%
Historical Data
2020-2021
Forecast period
2023-2030
Segments Covered
By Type
Fully Rugged Tablet
Semi Rugged Tablet
Ultra Rugged Tablet
By Operating System
Android
Windows
iOS
By Application
Aerospace & Defense
Automotive
Construction
Energy & Utilities
Manufacturing
Oil & Gas
Regions and Countries Covered
South and Central America
Brazil, Argentina, Rest of South and Central America
Market leaders and key company profiles
AAEON Technology Inc
Dell Technologies Inc
Panasonic Holdings Corp
Zebra Technologies Corp
Kontron AG
Get more information on this report
South & Central America Rugged Tablet Market Country and Regional Insights
Get more information on this report
Identical Market Reports with other Region/Countries
The List of Companies - South & Central America Rugged Tablet Market
1. AAEON Technology Inc 2. Dell Technologies Inc3. Panasonic Holdings Corp4. Zebra Technologies Corp5. Kontron AG
Frequently Asked Questions
How big is the South & Central America Rugged Tablet Market?
The South & Central America Rugged Tablet Market is valued at US$ 46.00 Million in 2022, it is projected to reach US$ 62.41 Million by 2030.
What is the CAGR for South & Central America Rugged Tablet Market by (2022 - 2030)?
As per our report South & Central America Rugged Tablet Market, the market size is valued at US$ 46.00 Million in 2022, projecting it to reach US$ 62.41 Million by 2030. This translates to a CAGR of approximately 3.9% during the forecast period.
What segments are covered in this report?
The South & Central America Rugged Tablet Market report typically cover these key segments-
Type (Fully Rugged Tablet, Semi Rugged Tablet, Ultra Rugged Tablet)
What is the historic period, base year, and forecast period taken for South & Central America Rugged Tablet Market?
The historic period, base year, and forecast period can vary slightly depending on the specific market research report. However, for the South & Central America Rugged Tablet Market report:
Historic Period : 2020-2021
Base Year : 2022
Forecast Period : 2023-2030
Who are the major players in South & Central America Rugged Tablet Market?
The South & Central America Rugged Tablet Market is populated by several key players, each contributing to its growth and innovation. Some of the major players include:
AAEON Technology Inc
Dell Technologies Inc
Panasonic Holdings Corp
Zebra Technologies Corp
Kontron AG
Who should buy this report?
The South & Central America Rugged Tablet Market report is valuable for diverse stakeholders, including:
Investors: Provides insights for investment decisions pertaining to market growth, companies, or industry insights. Helps assess market attractiveness and potential returns.
Industry Players: Offers competitive intelligence, market sizing, and trend analysis to inform strategic planning, product development, and sales strategies.
Suppliers and Manufacturers: Helps understand market demand for components, materials, and services related to concerned industry.
Researchers and Consultants: Provides data and analysis for academic research, consulting projects, and market studies.
Financial Institutions: Helps assess risks and opportunities associated with financing or investing in the concerned market.
Essentially, anyone involved in or considering involvement in the South & Central America Rugged Tablet Market value chain can benefit from the information contained in a comprehensive market report.


 Get Free Sample For South & Central America Rugged Tablet Market


