Analysis - by Component (Software and Hardware), Enterprise Size (Large Enterprises and SMEs), and Industry (BFSI, Automotive, Healthcare, Retail, Government, and Others)
No. of Pages:82
Report Code:
BMIRE00030791
Category:
Banking, Financial Services, and Insurance
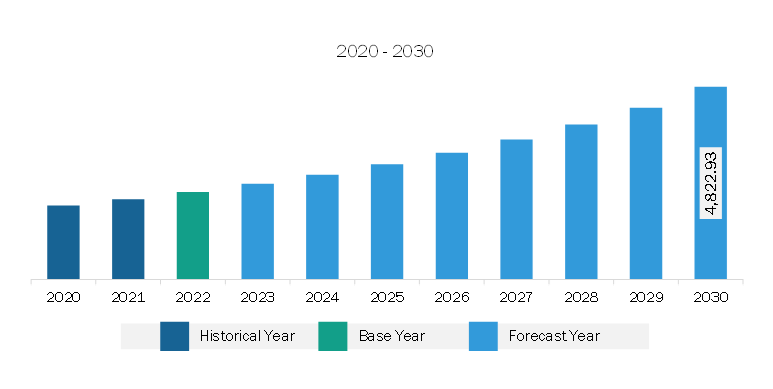
The North America voice-based payments market was valued at US$ 2,189.27 million in 2022 and is expected to reach US$ 4,822.93 million by 2030; it is estimated to register a CAGR of 10.4% from 2022 to 2030.
Preference for Contactless Payment Solutions Fuels North America Voice-Based Payments Market
The rising preference for contactless payment solutions within the business landscape represents a broader shift toward streamlined and secure transaction processes creating more demand for voice-based payments. This shift is driven by the modern consumer's requirement for convenience, speed, and enhanced safety in financial interactions. As the global marketplace evolves, businesses recognize the necessity to meet these preferences, leading to a surge in the adoption of contactless payment methods. Contactless payments, facilitated by technologies such as Near Field Communication (NFC), Radio Frequency Identification (RFID), and mobile wallets, offer a swift and efficient alternative to traditional payment methods. According to data from Mastercard, contactless transactions experienced a remarkable growth of over 40% globally in the first quarter of 2021. Additionally, it was found that 80 % of these contactless transactions were valued under US$ 25.
Consumers appreciate reduced physical contact, expedited transactions, and minimized potential health concerns, which are especially pertinent in the context of recent global events. Moreover, the seamless user experience associated with contactless payments fosters customer satisfaction and loyalty. Businesses embracing contactless payment solutions also benefit from improved operational efficiency. Faster transaction processing enhances customer throughput and reduces queues and checkout times, contributing to an overall positive shopping experience. Furthermore, data encryption and tokenization are essential in contactless transactions to provide enhanced security and mitigate risks associated with traditional payment methods. Thus, all the aforementioned factors are fueling the market growth.
North America Voice-Based Payments Market Overview
The North America voice-based payment market is segmented into the US, Canada, and Mexico. The financial landscape in North America is leading innovation fueled by open banking initiatives, digital transformation, and a continuous focus on customer experience. Treasurers and chief financial officers (CFOs) are making a continued shift toward investing in payment modernization, particularly in prioritizing digital payments.
According to Banked's 2023 research of the US consumer payment preferences, consumers expect more payment options that prioritize speed, convenience, and security and are changing their payment methods based on their circumstances. The study revealed that half of the US consumers would use more than one payment method if it were available at checkout. This percentage has seen a notable increase in 2022, by 43%, from 2019 showcasing the growing flexibility and versatility expected from modern payment platforms. The data shows that consumers are diversifying their financial habits, with 79.2% of respondents using 2-5 payment methods monthly, a significant rise from 57% in 2022. According to the same study, digital wallets and payment services, such as Apple Pay, Google Wallet, and PayPal, are also gaining traction in the US, with 59.6% of respondents saying they have used them. The appeal of these digital wallets lies in their ease of use and enhanced security features, making them a favored choice for a growing number of users. With such an increase in the use of digital payment methods, the demand for voice-based payments is also increasing in North America.
North America Voice-Based Payments Market Revenue and Forecast to 2030 (US$ Million)
North America Voice-Based Payments Market Segmentation
Based on component, the North America voice-based payments market is segmented into software and hardware. The software segment held a larger market share in 2022.
In terms of enterprise size, the North America voice-based payments market is segmented into large enterprises and SMEs. The large enterprises segment held a larger market share in 2022.
Based on industry, the North America voice-based payments market is segmented into BFSI, automotive, healthcare, retail, government, and others. The BFSI segment held the largest market share in 2022.
By country, the North America voice-based payments market is segmented into the US, Canada, and Mexico. The US dominated the North America voice-based payments market share in 2022.
Amazon.com Inc, Cerence Inc, Google LLC, Huawei Technologies Co Ltd, NCR VOYIX Corp, PayPal Holdings Inc, Paysafe Limited, and PCI Pal are some of the leading companies operating in the North America voice-based payments market.
North America Voice-Based Payments Market Strategic Insights
Get more information on this report
North America Voice-Based Payments Market Segmentation Analysis
North America Voice-Based Payments Market Report Highlights
North America Voice-Based Payments Report Scope
Report Attribute
Details
Market size in 2022
US$ 2,189.27 Million
Market Size by 2030
US$ 4,822.93 Million
CAGR (2022 - 2030)
10.4%
Historical Data
2020-2021
Forecast period
2023-2030
Segments Covered
By Component
Software and Hardware
By Enterprise Size
Large Enterprises and SMEs
Regions and Countries Covered
North America
US, Canada, Mexico
Market leaders and key company profiles
Amazon.com Inc
Cerence Inc
Google LLC
Huawei Technologies Co Ltd
NCR VOYIX Corp
PayPal Holdings Inc
Paysafe Limited
PCI Pal
Get more information on this report
North America Voice-Based Payments Market Country and Regional Insights
Get more information on this report
Identical Market Reports with other Region/Countries
The List of Companies - North America Voice-Based Payments Market
Amazon.com IncCerence IncGoogle LLCHuawei Technologies Co LtdNCR VOYIX CorpPayPal Holdings IncPaysafe LimitedPCI Pal
Frequently Asked Questions
How big is the North America Voice-Based Payments Market?
The North America Voice-Based Payments Market is valued at US$ 2,189.27 Million in 2022, it is projected to reach US$ 4,822.93 Million by 2030.
What is the CAGR for North America Voice-Based Payments Market by (2022 - 2030)?
As per our report North America Voice-Based Payments Market, the market size is valued at US$ 2,189.27 Million in 2022, projecting it to reach US$ 4,822.93 Million by 2030. This translates to a CAGR of approximately 10.4% during the forecast period.
What segments are covered in this report?
The North America Voice-Based Payments Market report typically cover these key segments-
Component (Software and Hardware)
Enterprise Size (Large Enterprises and SMEs)
What is the historic period, base year, and forecast period taken for North America Voice-Based Payments Market?
The historic period, base year, and forecast period can vary slightly depending on the specific market research report. However, for the North America Voice-Based Payments Market report:
Historic Period : 2020-2021
Base Year : 2022
Forecast Period : 2023-2030
Who are the major players in North America Voice-Based Payments Market?
The North America Voice-Based Payments Market is populated by several key players, each contributing to its growth and innovation. Some of the major players include:
Amazon.com Inc
Cerence Inc
Google LLC
Huawei Technologies Co Ltd
NCR VOYIX Corp
PayPal Holdings Inc
Paysafe Limited
PCI Pal
Who should buy this report?
The North America Voice-Based Payments Market report is valuable for diverse stakeholders, including:
Investors: Provides insights for investment decisions pertaining to market growth, companies, or industry insights. Helps assess market attractiveness and potential returns.
Industry Players: Offers competitive intelligence, market sizing, and trend analysis to inform strategic planning, product development, and sales strategies.
Suppliers and Manufacturers: Helps understand market demand for components, materials, and services related to concerned industry.
Researchers and Consultants: Provides data and analysis for academic research, consulting projects, and market studies.
Financial Institutions: Helps assess risks and opportunities associated with financing or investing in the concerned market.
Essentially, anyone involved in or considering involvement in the North America Voice-Based Payments Market value chain can benefit from the information contained in a comprehensive market report.


 Get Free Sample For North America Voice-Based Payments Market


