Analysis - by Component (Hardware and Software), Enterprise Size (SMEs and Large Enterprise), Application (Serialization and Aggregation), and End User (Pharmaceutical, Medical Devices, Consumer Goods, Food & Beverages, and Others)
No. of Pages:105
Report Code:
BMIRE00030527
Category:
Technology, Media and Telecommunications
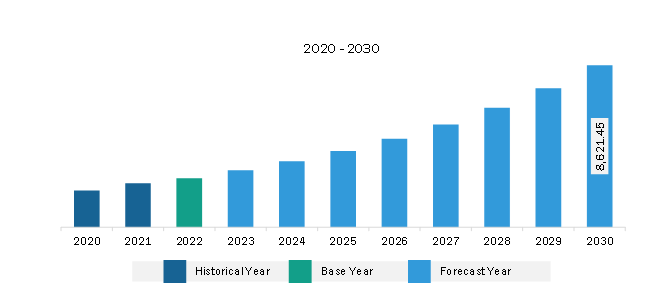
The North America track and trace solutions market was valued at US$ 2,607.35 million in 2022 and is expected to reach US$ 8,621.45 million by 2030; it is estimated to register a CAGR of 16.1% from 2022 to 2030.
Implementation of Serialization to Combat Counterfeit Drugs Fuels North America Track and Trace Solutions Market
Globally, pharmaceutical companies are adhering to the regulatory compliance for serialization to ensure anti-counterfeiting and traceability of drugs. Most developed and developing economies have either already laid out the regulatory roadmap for serialization or are in the process of doing so. The regulatory push to secure the pharmaceutical supply chain is due to the rising drug-related illegal activities and supply chain inefficiencies. Efforts are aimed at addressing drug counterfeits and unauthorized parallel supply chains, improving supply chain visibility, tracking returns or recalls, and the scarcity of data-driven tools for predicting patient behavior. A few examples of government regulations mandating the serialization of medical products include:
In the US, the Drug Supply Chain Security Act (DSCSA) started in 2013. The DSCSA defines the requirements for an interoperable electronic system to identify and trace pharmaceutical products throughout their distribution in the country. As part of the requirements, pharmaceutical products must be marked with a National Drug Code (NDC), serial number, lot number, and expiration date. The entire supply chain is expected to be electronically integrated, and all nodes of traceability are to be established by November 2023.
The Food and Drug Administration (FDA) mandates manufacturers to track specific devices through the entire distribution chain when and if they receive an order from the FDA to implement a tracking system. These devices could belong to Class I, II, or III.
Governments worldwide believe that counterfeiting is an organized crime that can be tackled significantly by implementing product serialization, and many countries are taking steps in this regard. So, serialization enables running advanced analytics programs to gather deep insights into consumption patterns, geographical penetration, sales, marketing spend effectiveness, etc. According to the 2013 Drug Supply Chain Security Act, starting from November 2017, all pharmaceutical companies selling prescription drug products in the US must serialize each salable drug unit to aid tracking from manufacturer to pharmacy or doctor's office.
If companies don't serialize, no wholesalers in the US will purchase their products. Apart from furnishing quality, visibility, and complete traceability within the supply chain, successful serialization programs will be a key differentiator and a clear competitive reward for the companies. Thus, the track and trace solutions market will continue to propel significantly during the forecast period.
North America Track and Trace Solutions Market Overview
The North America track & trace solution market is segmented into the US, Canada, and Mexico. The market growth in this region is attributed due to the presence of large players launching innovative product launches particularly track and trace, growing product introduction in the region, and technological advancements in track & trace solution.
In the US, batch-level tracking has been mandatory since 2015, with package-level serialization obligatory since 2017. According to the Drug Supply Chain Security Act (DSCSA) report, the unit-level traceability of the supply chain is expected to be done in the US by 2023.
Similarly, the Food and Drug Administration (FDA) mandates reveal that all medical devices sold in the US have to be labelled with a unique device identifier (UDI) and production identifier (involving lot or serial number and expiration date), and information has to be stored in the Global UDI Database (GUDID). Also, medical devices intended to be reprocessed must have a permanent marking on devices, ensuring UDI compliance. Through such mandates, can improve the detection and monitor notification of fake products in the supply chain in the US.
North America Track and Trace Solutions Market Revenue and Forecast to 2030 (US$ Million)
North America Track and Trace Solutions Market Segmentation
Based on component, the North America track and trace solutions market is bifurcated into hardware and software. The software segment held a larger North America track and trace solutions market share in 2022. Furthermore, the software segment is subcategorized into plant manager, line controller, and others. Additionally, the hardware segment is subsegmented into barcode scanner, radiofrequency identification (RFID) reader, and others.
In terms of enterprise size, the North America track and trace solutions market is bifurcated into SMEs and large enterprise. The large enterprise segment held a larger North America track and trace solutions market share in 2022.
By application, the North America track and trace solutions market is divided into serialization solutions and aggregation solutions. The serialization solutions segment held a larger North America track and trace solutions market share in 2022.
In terms of end user, the North America track and trace solutions market is categorized into pharmaceutical, medical devices, consumer goods, food & beverages, and others. The consumer goods segment held the largest North America track and trace solutions market share in 2022.
Based on country, the North America track and trace solutions market is categorized into the US, Canada, and Mexico. The US dominated the North America track and trace solutions market share in 2022.
Sys-Tech Solutions Inc, SAP SE, Uhlmann Pac-Systeme GmbH & Co KG, WIPOTEC GmbH, Korber AG, Videojet Technologies Inc, Domino Printing Sciences plc, Kezzler AS, rfxcel Corp, NeuroTags Inc, Catalyx, and Jekson Vison Pvt Ltd. are some of the leading companies operating in the North America track and trace solutions market.
North America Track and Trace Solutions Market Strategic Insights
Get more information on this report
North America Track and Trace Solutions Market Segmentation Analysis
North America Track and Trace Solutions Market Report Highlights
North America Track and Trace Solutions Report Scope
Report Attribute
Details
Market size in 2022
US$ 2,607.35 Million
Market Size by 2030
US$ 8,621.45 Million
CAGR (2022 - 2030)
16.1%
Historical Data
2020-2021
Forecast period
2023-2030
Segments Covered
By Component
Hardware
Software
By Enterprise Size
SMEs and Large Enterprise
By End User
Pharmaceutical
Medical Devices
Consumer Goods
Food & Beverages
Regions and Countries Covered
North America
US, Canada, Mexico
Market leaders and key company profiles
Sys-Tech Solutions Inc
SAP SE
Uhlmann Pac-Systeme GmbH & Co KG
WIPOTEC GmbH
Korber AG
Videojet Technologies Inc
Domino Printing Sciences plc
Kezzler AS
rfxcel Corp
NeuroTags Inc
Catalyx
Jekson Vison Pvt Ltd
Get more information on this report
North America Track and Trace Solutions Market Country and Regional Insights
Get more information on this report
Identical Market Reports with other Region/Countries
The List of Companies - North America Track and Trace Solutions Market
1. Sys-Tech Solutions Inc 2. SAP SE 3. Uhlmann Pac-Systeme GmbH & Co KG 4. WIPOTEC GmbH 5. Korber AG 6. Videojet Technologies Inc 7. Domino Printing Sciences plc 8. Kezzler AS 9. rfxcel Corp 10. NeuroTags Inc 11. Catalyx 12. Jekson Vison Pvt Ltd
Frequently Asked Questions
How big is the North America Track and Trace Solutions Market?
The North America Track and Trace Solutions Market is valued at US$ 2,607.35 Million in 2022, it is projected to reach US$ 8,621.45 Million by 2030.
What is the CAGR for North America Track and Trace Solutions Market by (2022 - 2030)?
As per our report North America Track and Trace Solutions Market, the market size is valued at US$ 2,607.35 Million in 2022, projecting it to reach US$ 8,621.45 Million by 2030. This translates to a CAGR of approximately 16.1% during the forecast period.
What segments are covered in this report?
The North America Track and Trace Solutions Market report typically cover these key segments-
Component (Hardware, Software)
Enterprise Size (SMEs and Large Enterprise)
End User (Pharmaceutical, Medical Devices, Consumer Goods, Food & Beverages)
What is the historic period, base year, and forecast period taken for North America Track and Trace Solutions Market?
The historic period, base year, and forecast period can vary slightly depending on the specific market research report. However, for the North America Track and Trace Solutions Market report:
Historic Period : 2020-2021
Base Year : 2022
Forecast Period : 2023-2030
Who are the major players in North America Track and Trace Solutions Market?
The North America Track and Trace Solutions Market is populated by several key players, each contributing to its growth and innovation. Some of the major players include:
Sys-Tech Solutions Inc
SAP SE
Uhlmann Pac-Systeme GmbH & Co KG
WIPOTEC GmbH
Korber AG
Videojet Technologies Inc
Domino Printing Sciences plc
Kezzler AS
rfxcel Corp
NeuroTags Inc
Catalyx
Jekson Vison Pvt Ltd
Who should buy this report?
The North America Track and Trace Solutions Market report is valuable for diverse stakeholders, including:
Investors: Provides insights for investment decisions pertaining to market growth, companies, or industry insights. Helps assess market attractiveness and potential returns.
Industry Players: Offers competitive intelligence, market sizing, and trend analysis to inform strategic planning, product development, and sales strategies.
Suppliers and Manufacturers: Helps understand market demand for components, materials, and services related to concerned industry.
Researchers and Consultants: Provides data and analysis for academic research, consulting projects, and market studies.
Financial Institutions: Helps assess risks and opportunities associated with financing or investing in the concerned market.
Essentially, anyone involved in or considering involvement in the North America Track and Trace Solutions Market value chain can benefit from the information contained in a comprehensive market report.


 Get Free Sample For North America Track and Trace Solutions Market


