Analysis – by Type (Pressure Sensor, Temperature Sensor, Flow Sensor, and Level Sensor), Connectivity (Wired and Wireless), Function (Remote Monitoring, Condition Monitoring and Maintenance, Analysis and Simulation, and Others), and Application (Upstream, Midstream, and Downstream)
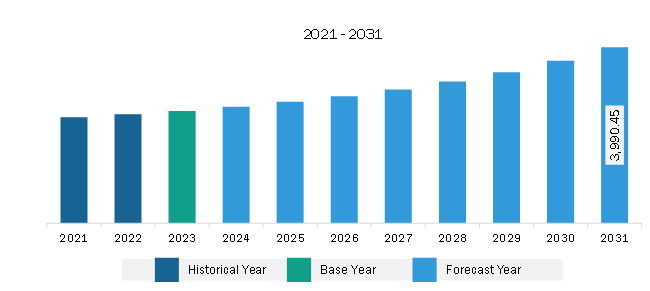
The North America oil & gas sensors market was valued at US$ 2,545.65 million in 2023 and is expected to reach US$ 3,990.45 million by 2031; it is estimated to register a CAGR of 5.8% from 2023 to 2031.
Rising Investment in Capacity Expansion of Offshore Projects Fuels North America Oil & Gas Sensors Market
Offshore renewables, such as offshore wind and ocean energy, have the potential to speed the global energy transition while creating new economic and social opportunities. According to the most recent data published by the International Renewable Energy Agency (IRENA) in June 2023, the capacity of offshore wind accounted to be more than 55 gigawatts (GW) in 2022, while ocean energy installed capacity was 0.535 GW in 2021. Offshore wind and ocean energy are expected to generate 380 GW and 350 GW, respectively, by 2030 due to increasing investment in ocean energy technologies. This increases the adoption of oil & gas sensors among users to monitor water quality, detect oil spills, and assess the impact of offshore drilling activities on oil & gas applications.
Investments in offshore projects are growing worldwide. Such investments increase the demand and adoption of temperature, pressure, flow, and level sensors to monitor the performance and integrity of offshore wind turbines, oil platforms, and underwater pipelines. Thus, rising investment in capacity expansion of offshore projects is expected to generate numerous opportunities for the growth of the oil & gas sensors market during the forecast period.
North America Oil & Gas Sensors Market Overview
The oil & gas sensors market growth in North America is attributed to the growing adoption of oil & gas sensors across upstream, midstream, and downstream applications, among others, for monitoring the working of devices and equipment used in the energy & power sector. Moreover, expansion activities of the oil & gas industries are anticipated to create lucrative opportunities for market growth during the forecast period. According to data published by the US Energy Information Administration in April 2024, the US and Canada respectively rank 1st and 4th among the top oil producers in the world. The US and Canada produced 21.91 and 5.76 million barrels per day in 2023, respectively, accounting for 22% and 6% shares of global oil production. Increasing demand and production of oil results in a greater scale of oil & gas production, resulting in the need for a larger number of sensors at plants for performance monitoring. In June 2023, PetroChem Canada announced its plan to take measures to promote the development of petrochemical industries. Petrochemical refineries require oil & gas sensors such as temperature and flow sensors in numerous applications, including crude oil distillation, catalytic cracking, and hydroprocessing. These sensors are used for maintaining precise temperature profiles within distillation columns, thereby ensuring the proper separation of crude oil into diesel and gasoline.
North America Oil & Gas Sensors Market Revenue and Forecast to 2031 (US$ Million)
North America Oil & Gas Sensors Market Segmentation
Based on type, the North America oil & gas sensors market is segmented pressure sensor, temperature sensor, flow sensor, and level sensor. The pressure sensor segment held the largest market share in 2023.
In terms of connectivity, the North America oil & gas sensors market is bifurcated into wired and wireless. The wired segment held a larger market share in 2023.
By function, the North America oil & gas sensors market is segmented into remote monitoring, condition monitoring and maintenance, analysis and simulation, and others. The remote monitoring segment held the largest market share in 2023.
By application, the North America oil & gas sensors market is segmented into upstream, midstream, and downstream. The upstream segment held the largest market share in 2023.
By country, the North America oil & gas sensors market is segmented into the US, Canada, and Mexico. The US dominated the North America oil & gas sensors market share in 2023.
Honeywell International Inc, TE Connectivity Ltd, Robert Bosch GmbH, ABB Ltd, Siemens AG, Rockwell Automation Inc, Analog Devices Inc, Emerson Electric Co, SKF AB, and GE Vernova are some of the leading companies operating in the North America oil & gas sensors market.
North America Oil & Gas Sensors Market Strategic Insights
Get more information on this report
North America Oil & Gas Sensors Market Segmentation Analysis
North America Oil & Gas Sensors Market Report Highlights
North America Oil & Gas Sensors Report Scope
Report Attribute
Details
Market size in 2023
US$ 2,545.65 Million
Market Size by 2031
US$ 3,990.45 Million
CAGR (2023 - 2031)
5.8%
Historical Data
2021-2022
Forecast period
2024-2031
Segments Covered
By Type
Pressure Sensor
Temperature Sensor
Flow Sensor
Level Sensor
By Connectivity
Wired
Wireless
By Function
Remote Monitoring
Condition Monitoring and Maintenance
Analysis and Simulation
By Application
Upstream
Midstream
Downstream
Regions and Countries Covered
North America
US, Canada, Mexico
Market leaders and key company profiles
Honeywell International Inc
TE Connectivity Ltd
Robert Bosch GmbH
ABB Ltd
Siemens AG
Rockwell Automation Inc
Analog Devices Inc
Emerson Electric Co
SKF AB
GEVernova
Get more information on this report
North America Oil & Gas Sensors Market Country and Regional Insights
Get more information on this report
Identical Market Reports with other Region/Countries
The List of Companies - North America Oil & Gas Sensors Market
Honeywell International Inc TE Connectivity Ltd Robert Bosch GmbH ABB Ltd Siemens AG Rockwell Automation Inc Analog Devices Inc Emerson Electric Co SKF AB GE Vernova
Frequently Asked Questions
How big is the North America Oil & Gas Sensors Market?
The North America Oil & Gas Sensors Market is valued at US$ 2,545.65 Million in 2023, it is projected to reach US$ 3,990.45 Million by 2031.
What is the CAGR for North America Oil & Gas Sensors Market by (2023 - 2031)?
As per our report North America Oil & Gas Sensors Market, the market size is valued at US$ 2,545.65 Million in 2023, projecting it to reach US$ 3,990.45 Million by 2031. This translates to a CAGR of approximately 5.8% during the forecast period.
What segments are covered in this report?
The North America Oil & Gas Sensors Market report typically cover these key segments-
Type (Pressure Sensor, Temperature Sensor, Flow Sensor, Level Sensor)
Connectivity (Wired, Wireless)
Function (Remote Monitoring, Condition Monitoring and Maintenance, Analysis and Simulation)
Application (Upstream, Midstream, Downstream)
What is the historic period, base year, and forecast period taken for North America Oil & Gas Sensors Market?
The historic period, base year, and forecast period can vary slightly depending on the specific market research report. However, for the North America Oil & Gas Sensors Market report:
Historic Period : 2021-2022
Base Year : 2023
Forecast Period : 2024-2031
Who are the major players in North America Oil & Gas Sensors Market?
The North America Oil & Gas Sensors Market is populated by several key players, each contributing to its growth and innovation. Some of the major players include:
Honeywell International Inc
TE Connectivity Ltd
Robert Bosch GmbH
ABB Ltd
Siemens AG
Rockwell Automation Inc
Analog Devices Inc
Emerson Electric Co
SKF AB
GEVernova
Who should buy this report?
The North America Oil & Gas Sensors Market report is valuable for diverse stakeholders, including:
Investors: Provides insights for investment decisions pertaining to market growth, companies, or industry insights. Helps assess market attractiveness and potential returns.
Industry Players: Offers competitive intelligence, market sizing, and trend analysis to inform strategic planning, product development, and sales strategies.
Suppliers and Manufacturers: Helps understand market demand for components, materials, and services related to concerned industry.
Researchers and Consultants: Provides data and analysis for academic research, consulting projects, and market studies.
Financial Institutions: Helps assess risks and opportunities associated with financing or investing in the concerned market.
Essentially, anyone involved in or considering involvement in the North America Oil & Gas Sensors Market value chain can benefit from the information contained in a comprehensive market report.


 Get Free Sample For North America Oil & Gas Sensors Market


