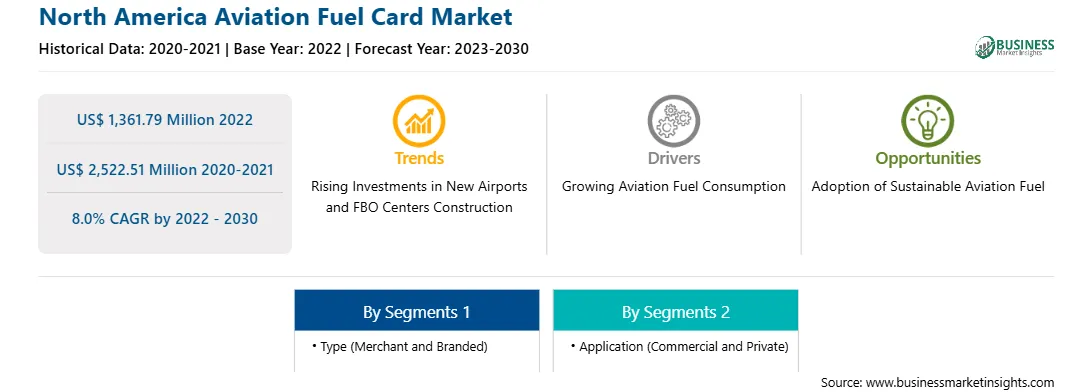
Marktprognose für Flugtankkarten in Nordamerika bis 2030 – Regionale Analyse – nach Typ (Handels- und Markenprodukte) und Anwendung (kommerziell und privat)
Steigender Kraftstoffverbrauch treibt den nordamerikanischen Markt für Tankkarten für Flugreisen an
Aufgrund der hohen Nachfrage nach Flugreisen ist der Gesamtkraftstoffverbrauch gestiegen. Im Jahr 2022 beförderten US-Fluggesellschaften 194 Millionen mehr Passagiere als im Jahr 2021, ein Anstieg von 30 % gegenüber dem Vorjahr. Von Januar bis Dezember 2022 beförderten US-Fluggesellschaften 853 Millionen Passagiere, gegenüber 658 Millionen im Jahr 2021 und 388 Millionen im Jahr 2020.
Laut den 2019 vom International Council on Clean Transportation veröffentlichten Daten verbrauchten inländische Fluggesellschaften in den USA im Jahr 2018 12,5 Milliarden Gallonen Treibstoff, ein Anstieg von 17 % seit 2009. Prognosen des US-Energieministeriums aus dem Jahr 2020 zufolge wird der globale Markt für kommerzielles Düsentreibstoff, der derzeit 106 Milliarden Gallonen verbraucht, bis 2050 voraussichtlich auf über 230 Milliarden Gallonen wachsen. Die obigen Statistiken deuten also darauf hin, dass der Treibstoffverbrauch mit der Zunahme des Flugverkehrs steigt. Historisch gesehen hat die Luftfahrtindustrie ihren Treibstoff auf verschiedene Weise bezahlt, je nach den wirtschaftlichen Bedingungen der Treibstoffindustrie und den bestehenden Vereinbarungen. Fluggesellschaften und andere Luftfahrtindustrien kaufen Treibstoff häufig auf dem Spotmarkt, entweder direkt von Ölkonzernen oder über Treibstoffmakler. Traditionelle Methoden sind jedoch viel teurer, da viele Interessengruppen am Prozess beteiligt waren. Die Tankkarte hat es der Fluggesellschaft ermöglicht, direkt bei zertifizierten Lieferanten oder dem Produktionsunternehmen einzukaufen. Darüber hinaus ermöglicht die Tankkarte den Kraftstoffverbrauch und die Nachverfolgung, was zur weiteren Verbrauchsoptimierung beiträgt. Der zunehmende Flugverkehr hat also den Gesamtkraftstoffverbrauch erhöht, was die Einführung von Tankkarten aufgrund verschiedener Vorteile wie Rabatte, Kostenverfolgung und Kraftstoffqualität vorantreibt.
Marktübersicht für Flugtankkarten in Nordamerika
Industrieländer wie die USA entwickeln stark nachhaltigen Flugkraftstoff, was lukrative Möglichkeiten für den Markt für Flugtankkarten schafft. Laut dem US Government Accountability Office hat die Produktion und Verwendung von nachhaltigem Flugkraftstoff in den USA in den letzten Jahren zugenommen; dieser Kraftstoff wird jetzt von Fluggesellschaften an zwei großen Verkehrsflughäfen in Kalifornien verwendet. Während die USA im Jahr 2022 15,8 Millionen Gallonen produzierten, trugen sie zu weniger als 0,1 % des gesamten von großen US-Fluggesellschaften verbrauchten Düsentreibstoffs bei. In Anbetracht der geringen Margen und Vorteile von Flugtankkarten wird erwartet, dass die Einführung und Verwendung von Flugtankkarten im Prognosezeitraum zunehmen wird.
Umsatz und Prognose des nordamerikanischen Marktes für Flugtankkarten bis 2030 (in Mio. USD)
Segmentierung des nordamerikanischen Marktes für Flugtankkarten
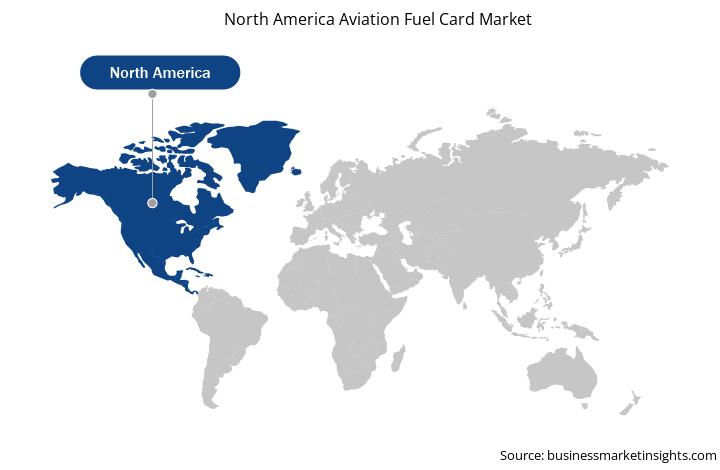
Der nordamerikanische Markt für Flugtankkarten ist nach Typ, Anwendung und Land kategorisiert.
Basierend auf dem Typ ist der nordamerikanische Markt für Flugtankkarten in Händler- und Markenmarkt unterteilt. Das Händlersegment hatte 2022 einen größeren Marktanteil an nordamerikanischen Flugtankkarten.
In Bezug auf die Anwendung ist der nordamerikanische Markt für Flugtankkarten in gewerbliche und private Märkte unterteilt. Das gewerbliche Segment hatte 2022 einen größeren Marktanteil an nordamerikanischen Flugtankkarten.
Nach Ländern ist der nordamerikanische Markt für Flugtankkarten in die USA, Kanada und Mexiko unterteilt. Die USA dominierten im Jahr 2022 den nordamerikanischen Markt für Tankkarten für Flugzeuge.
Shell Plc, BP Plc, Associated Energy Group LLC, TITAN Aviation Fuels Inc, CSI Enterprises Inc, TotalEnergies SE, EPIC Aviation LLC, Kropp Holdings Inc, Avfuel Corp und Multi Service Corp. gehören zu den führenden Unternehmen auf dem nordamerikanischen Markt für Tankkarten für Flugzeuge.
Table of Content
1. Introduction
1.1 The Insight Partners Research Report Guidance
1.2 Market Segmentation
2. Executive Summary
2.1 Key Insights
2.2 Market Attractiveness
3. Research Methodology
3.1 Coverage
3.2 Secondary Research
3.3 Primary Research
4. North America Aviation Fuel Card Market Landscape
4.1 Overview
4.2 PORTER Analysis
4.3 Ecosystem Analysis
4.3.1 Fuel Card Suppliers
4.3.1.1 Branded Fuel Card Suppliers
4.3.1.2 Merchant Fuel Card Suppliers
4.3.2 End Users
4.3.3 List of Aviation Fuel Card Suppliers
5. North America Aviation Fuel Card Market - Key Industry Dynamics
5.1 North America Aviation Fuel Card Market - Key Industry Dynamics
5.2 Market Drivers
5.2.1 Rising Fuel Consumption
5.2.2 Growing Demand for the Cost Optimization Using Fuel Cards
5.3 Market Restraints
5.3.1 Presence of Alternative Payment Methods
5.4 Market Opportunities
5.4.1 Growing Adoption of Sustainable Aviation Fuel
5.5 Future Trends
5.5.1 Rising Investments in New Airport and Fixed Base Operator Center Construction
5.6 Impact of Drivers and Restraints:
6. Aviation Fuel Card Market - North America Market Analysis
6.1 North America Aviation Fuel Card Market Revenue (US$ Million), 2020 - 2030
6.2 North America Aviation Fuel Card Market Forecast and Analysis
7. North America Aviation Fuel Card Market Analysis - Type
7.1 Merchant
7.1.1 Overview
7.1.2 Merchant: North America Aviation Fuel Card Market Revenue and Forecast to 2030 (US$ Million)
7.2 Branded
7.2.1 Overview
7.2.2 Branded: North America Aviation Fuel Card Market, Revenue and Forecast to 2030 (US$ Million)
8. North America Aviation Fuel Card Market Analysis - Application
8.1 Commercial
8.1.1 Overview
8.1.2 Commercial : North America Aviation Fuel Card Market Revenue and Forecast to 2030 (US$ Million)
8.2 Private
8.2.1 Overview
8.2.2 Private : North America Aviation Fuel Card Market Revenue and Forecast to 2030 (US$ Million)
9. North America Aviation Fuel Card Market - Country Analysis
9.1 Overview
9.1.1 North America Aviation Fuel Card Market Overview
9.1.2 North America Aviation Fuel Card Market Revenue and Forecasts and Analysis - By Country
9.1.2.1 North America Aviation Fuel Card Market Revenue and Forecasts and Analysis - By Country
9.1.2.2 US Aviation Fuel Card Market Revenue and Forecasts to 2030 (US$ Mn)
9.1.2.2.1 US Aviation Fuel Card Market Breakdown by Type
9.1.2.2.2 US Aviation Fuel Card Market Breakdown by Application
9.1.2.3 Canada Aviation Fuel Card Market Revenue and Forecasts to 2030 (US$ Mn)
9.1.2.3.1 Canada Aviation Fuel Card Market Breakdown by Type
9.1.2.3.2 Canada Aviation Fuel Card Market Breakdown by Application
9.1.2.4 Mexico Aviation Fuel Card Market Revenue and Forecasts to 2030 (US$ Mn)
9.1.2.4.1 Mexico Aviation Fuel Card Market Breakdown by Type
9.1.2.4.2 Mexico Aviation Fuel Card Market Breakdown by Application
10. Industry Landscape
10.1 Overview
10.2 Market Initiative
10.3 Product Development
10.4 Mergers & Acquisitions
11. Company Profiles
11.1 Shell Plc
11.1.1 Key Facts
11.1.2 Business Description
11.1.3 Products and Services
11.1.4 Financial Overview
11.1.5 SWOT Analysis
11.1.6 Key Developments
11.2 BP Plc
11.2.1 Key Facts
11.2.2 Business Description
11.2.3 Products and Services
11.2.4 Financial Overview
11.2.5 SWOT Analysis
11.2.6 Key Developments
11.3 Associated Energy Group LLC
11.3.1 Key Facts
11.3.2 Business Description
11.3.3 Products and Services
11.3.4 Financial Overview
11.3.5 SWOT Analysis
11.3.6 Key Developments
11.4 TITAN Aviation Fuels Inc
11.4.1 Key Facts
11.4.2 Business Description
11.4.3 Products and Services
11.4.4 Financial Overview
11.4.5 SWOT Analysis
11.4.6 Key Developments
11.5 CSI Enterprises Inc
11.5.1 Key Facts
11.5.2 Business Description
11.5.3 Products and Services
11.5.4 Financial Overview
11.5.5 SWOT Analysis
11.5.6 Key Developments
11.6 TotalEnergies SE
11.6.1 Key Facts
11.6.2 Business Description
11.6.3 Products and Services
11.6.4 Financial Overview
11.6.5 SWOT Analysis
11.6.6 Key Developments
11.7 EPIC Aviation LLC
11.7.1 Key Facts
11.7.2 Business Description
11.7.3 Products and Services
11.7.4 Financial Overview
11.7.5 SWOT Analysis
11.7.6 Key Developments
11.8 Kropp Holdings Inc
11.8.1 Key Facts
11.8.2 Business Description
11.8.3 Products and Services
11.8.4 Financial Overview
11.8.5 SWOT Analysis
11.8.6 Key Developments
11.9 Avfuel Corp
11.9.1 Key Facts
11.9.2 Business Description
11.9.3 Products and Services
11.9.4 Financial Overview
11.9.5 SWOT Analysis
11.9.6 Key Developments
11.10 Multi Service Corp
11.10.1 Key Facts
11.10.2 Business Description
11.10.3 Products and Services
11.10.4 Financial Overview
11.10.5 SWOT Analysis
11.10.6 Key Developments
12. Appendix
12.1 Word Index
List of Tables
Table 1. North America Aviation Fuel Card Market Segmentation
Table 2. List of Vendors in the Value Chain
Table 3. North America Aviation Fuel Card Market Revenue and Forecasts to 2030 (US$ Million)
Table 4. North America Aviation Fuel Card Market Revenue and Forecasts to 2030 (US$ Million) - Type
Table 5. North America Aviation Fuel Card Market Revenue and Forecasts to 2030 (US$ Million) - Application
Table 6. North America Aviation Fuel Card Market Revenue and Forecasts to 2030 (US$ Mn) - By Country
Table 7. US Aviation Fuel Card Market Revenue and Forecasts to 2030 (US$ Mn) - By Type
Table 8. US Aviation Fuel Card Market Revenue and Forecasts to 2030 (US$ Mn) - By Application
Table 9. Canada Aviation Fuel Card Market Revenue and Forecasts to 2030 (US$ Mn) - By Type
Table 10. Canada Aviation Fuel Card Market Revenue and Forecasts to 2030 (US$ Mn) - By Application
Table 11. Mexico Aviation Fuel Card Market Revenue and Forecasts to 2030 (US$ Mn) - By Type
Table 12. Mexico Aviation Fuel Card Market Revenue and Forecasts to 2030 (US$ Mn) - By Application
Table 13. List of Abbreviation
List of Figures
Figure 1. North America Aviation Fuel Card Market Segmentation, By Country
Figure 2. PORTER Analysis
Figure 3. Ecosystem: North America Aviation Fuel Card Market
Figure 4. Impact Analysis of Drivers and Restraints
Figure 5. North America Aviation Fuel Card Market Revenue (US$ Million), 2020 - 2030
Figure 6. North America Aviation Fuel Card Market Share (%) - Type, 2022 and 2030
Figure 7. Merchant: North America Aviation Fuel Card Market Revenue and Forecasts to 2030 (US$ Million)
Figure 8. Branded: North America Aviation Fuel Card Market Revenue and Forecasts to 2030 (US$ Million)
Figure 9. North America Aviation Fuel Card Market Share (%) - Application, 2022 and 2030
Figure 10. Commercial : North America Aviation Fuel Card Market Revenue and Forecasts to 2030 (US$ Million)
Figure 11. Private : North America Aviation Fuel Card Market Revenue and Forecasts to 2030 (US$ Million)
Figure 12. North America Aviation Fuel Card Market Revenue, by Key Countries, (2022) (US$ Mn)
Figure 13. North America Aviation Fuel Card Market Breakdown by Key Countries, 2022 and 2030 (%)
Figure 14. US Aviation Fuel Card Market Revenue and Forecasts to 2030 (US$ Mn)
Figure 15. Canada Aviation Fuel Card Market Revenue and Forecasts to 2030 (US$ Mn)
Figure 16. Mexico Aviation Fuel Card Market Revenue and Forecasts to 2030 (US$ Mn)
1. Shell Plc
2. BP Plc
3. Associated Energy Group LLC
4. TITAN Aviation Fuels Inc
5. CSI Enterprises Inc
6. TotalEnergies SE
7. EPIC Aviation LLC
8. Kropp Holdings Inc
9. Avfuel Corp
10. Multi Service Corp
- Save and reduce time carrying out entry-level research by identifying the growth, size, leading players, and segments in the North America aviation fuel card market.
- Highlights key business priorities in order to assist companies to realign their business strategies.
- The key findings and recommendations highlight crucial progressive industry trends in the North America aviation fuel card market, thereby allowing players across the value chain to develop effective long-term strategies.
- Develop/modify business expansion plans by using substantial growth offering developed and emerging markets.
- Scrutinize in-depth North America market trends and outlook coupled with the factors driving the North America aviation fuel card market, as well as those hindering it.
- Enhance the decision-making process by understanding the strategies that underpin commercial interest with respect to client products, segmentation, pricing, and distribution.